
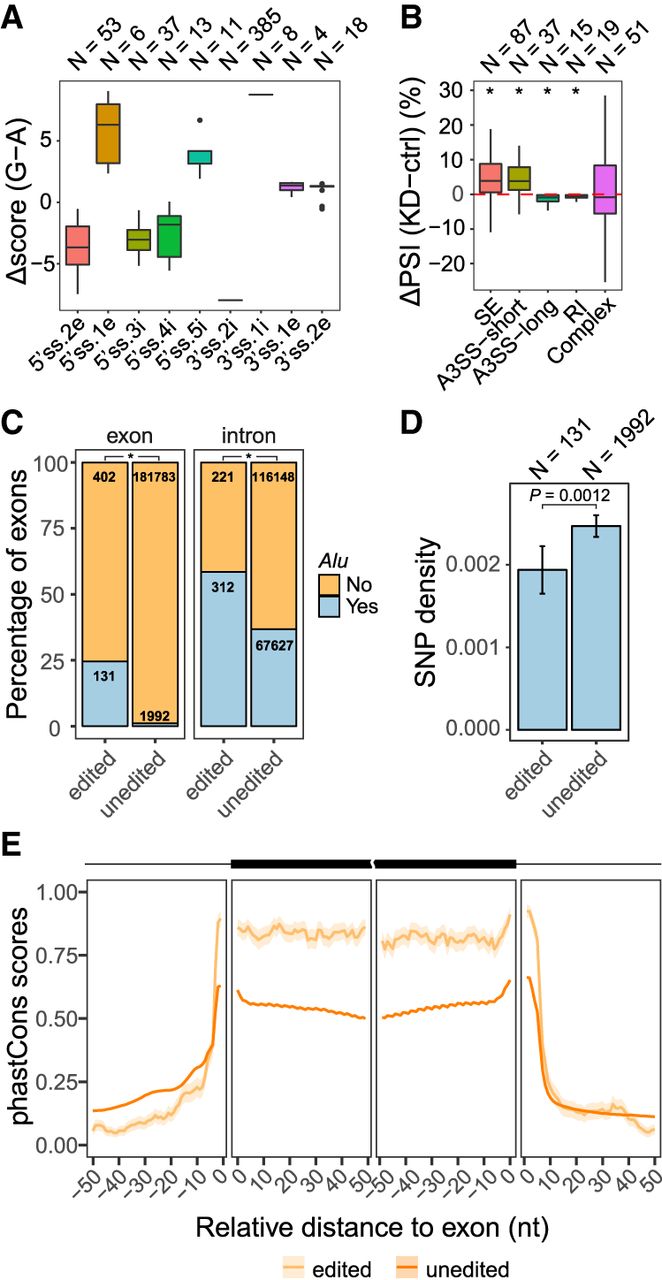
RNA editing sites located in splice site regions. (A) Box plot of the difference in splice site strength caused by A-to-I editing. Splice site scores were calculated using the maxEnt method (Yeo and Burge 2004): (5′ss) 5′ splice site; (3′ss) 3′ splice site; (i) intron; (e) exon; (N) number of editing sites. The number before i or e represents the distance (in nucleotides) from the exon–intron boundaries. Nucleotide positions without any editing sites in our data were excluded from this plot. (B) Box plot of PSI changes (ΔPSI) upon ADAR1 KD in U87MG cells measured via RNA-seq for exons with editing sites at the −2 intronic position of 3′ss (3′ss.2i), altering the canonical 3′ acceptor site from AG to GG: (SE) skipped exons; (A3SS-short) alternative 3′ss generating shorter exons given the edited G in the 3′ss; (A3SS-long) alternative 3′ss generating longer exons given the edited G in the 3′ss; (RI) retained introns; (Complex) complex splicing patterns; (N) number of exons; (*) P < 0.05 for ΔPSI ≠ 0 (Wilcoxon rank-sum test). (C) Percentage of exons or their upstream introns that overlap Alu repeats: (edited) exons or introns with editing sites in the 3′ss AG sequence; (unedited) all internal exons or introns without editing sites in the 3′ss. The number of exons or introns in each category is shown. The edited groups are significantly more enriched with Alus than unedited groups for both panels. (*) P < 2.2 × 10⁻¹⁶ (Fisher's exact test). (D) Density of SNPs (common SNPs in dbSNP version 150) in Alu-overlapping exons as described in C. Error bars represent standard errors. Edited exons have smaller SNP density than unedited ones (P = 0.0012, Wilcoxon rank-sum test). (E) Average phastCons scores of non-Alu-overlapping skipped exons (described in C) and their flanking intronic regions. Exon–intron boundaries are positioned at 0. The shaded area represents standard errors.


