
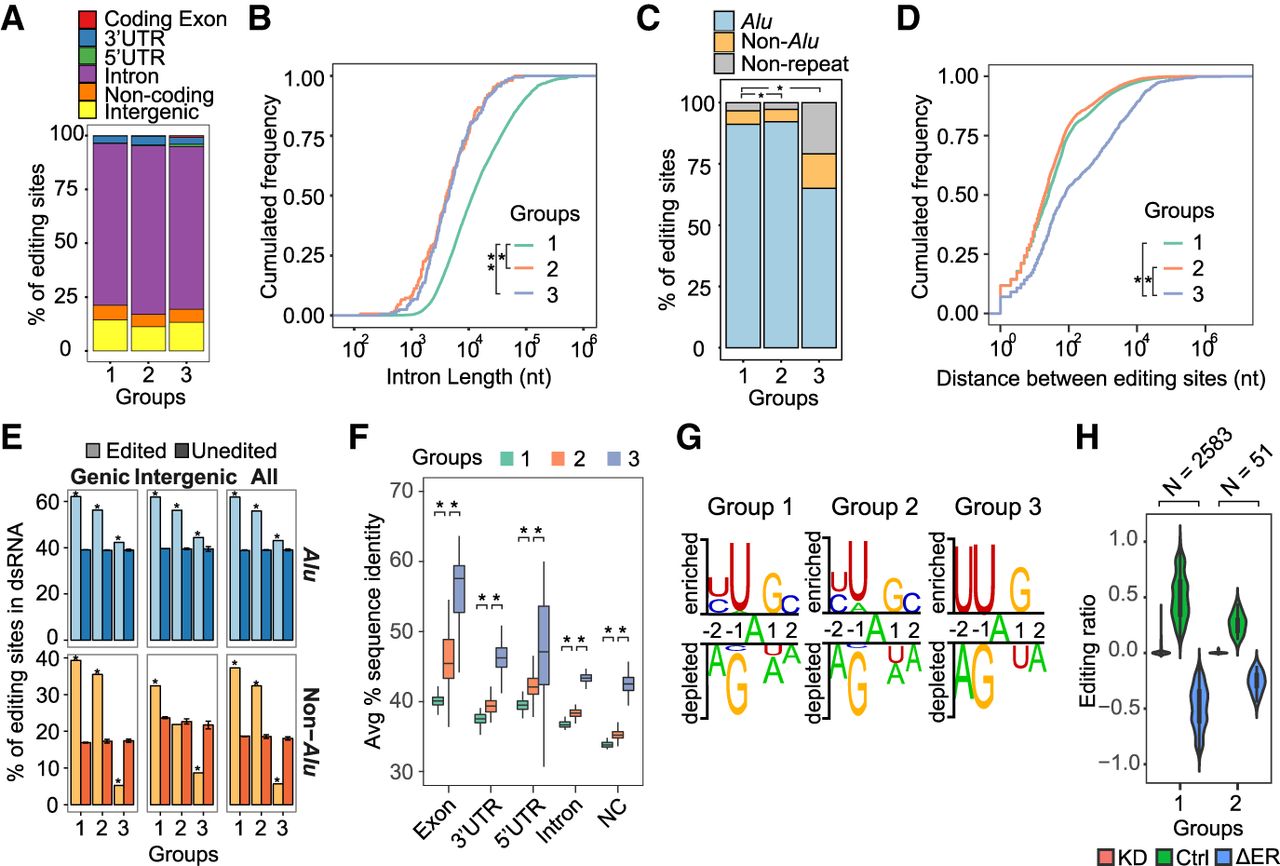
Characteristics of editing sites in different kinetic groups. (A) Genomic context of the editing sites. (B) Length of introns harboring editing sites: (*) P = 1.75 × 10⁻⁴ for group 1 versus 2; (**) P = 3.02 × 10⁻⁴ for group 1 versus 3 (Kolmogorov–Smirnov test). Groups 2 and 3 were not significantly different. (C) Presence of editing sites in Alus, non-Alu repeats, and nonrepeats: (*) P < 2.2 × 10⁻¹⁶ for group 1 versus 3 and group 2 versus 3 (Fisher's exact test). Groups 1 and 2 were not significantly different. (D) Closest distance (in nucleotides) between editing sites. For each editing site in a specific group, its closest neighboring editing site (regardless of group) was used to calculate this distance: (*) P = <2.2 × 10⁻¹⁶ for group 1 versus 3 and group 2 versus 3 (Kolmogorov–Smirnov test). Groups 1 and 2 were not significantly different. (E) Percentage of editing sites located in dsRNA structures predicted using BLASTN: (unedited) random As in the same type of genomic region as editing sites (Methods). Error bars represent 95% confidence interval based on 100 random trials; (*) P = <2.2 × 10⁻¹⁶ (Wilcoxon rank-sum test). (F) Average percent sequence identity across primates (Human, Chimp, Gorilla, Orangutan, Rhesus, Baboon, Marmoset, Tarsier, Mouse lemur, Bushbaby, and Tree shrew) calculated using the 46-way MULTIZ alignments (Kent et al. 2002). (NC) noncoding transcripts; (*) P < 2.2 × 10⁻¹⁶ (Wilcoxon rank-sum test). (G) Sequence consensus around the editing sites of each group, with the editing sites at position 0. Sequence motifs were identified via the Two Sample Logo program (Vacic et al. 2006). Random As that were in the same type of genomic region as editing sites were used as negative controls. (H) Editing ratios of groups 1 and 2 editing sites in U87MG ADAR1 knockdown (KD) and control (Ctrl) RNA-seq data (Bahn et al. 2012). The differences in editing ratios (ΔER) were calculated as (KD – Ctrl). The number of editing sites identifiable in the RNA-seq data is shown for each group (N).


