
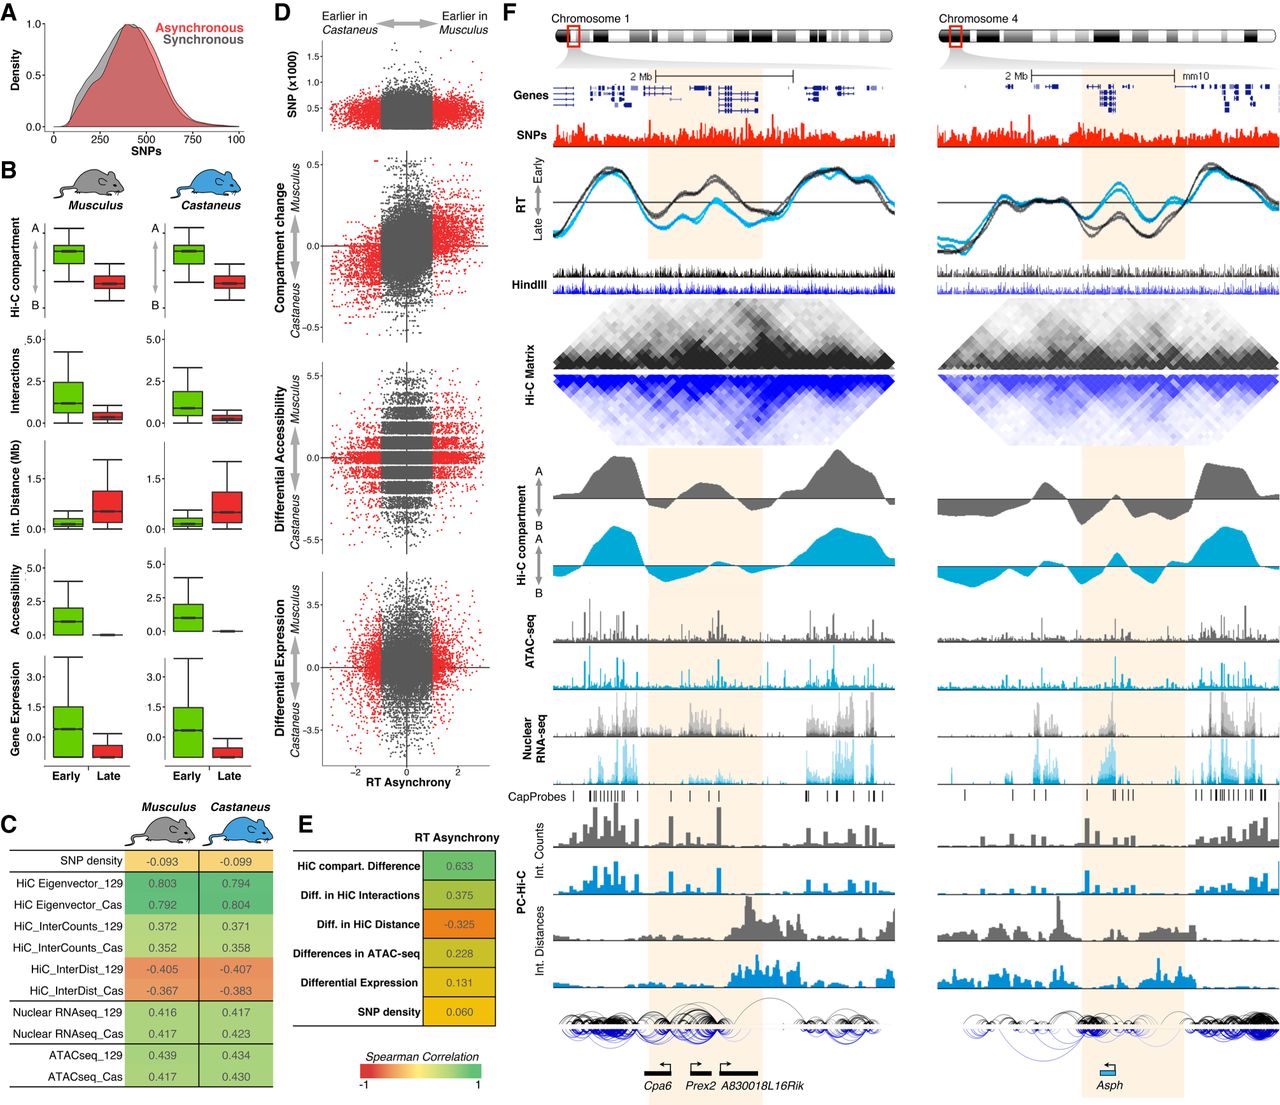
RT asynchrony correlates with genome organization. (A) RT synchronous and asynchronous genomic regions contain similar SNP densities. (B) Genome organization, chromatin accessibility, and gene expression of RT synchronous regions that replicate either early or late during S-phase. (C) Spearman correlation values of RT and distinct genomic features per genome. (D) Scatter plots of RT asynchrony vs. SNP density, changes in Hi-C compartments, differential accessibility, and differential expression. Hi-C data were obtained from Giorgetti et al. (2016). (E) Spearman correlation values of RT asynchrony and changes in Hi-C compartments, Hi-C interaction counts and distances, differences in chromatin accessibility, and SNP density. (F) Two exemplary chromosome regions showing the RT asynchrony associated with changes in Hi-C compartments, differential expression, and distinct promoter-enhancer interactions. Two replicates of each cell line are shown in each plot of RT profiles. Allele-specific RT, total nuclear RNA-seq, and ATAC-seq were determined based on the SNPs shown in red. Allele-specific Hi-C and PC-Hi-C data were obtained using HindIII fragments containing SNPs for each genome (HindIII track). Differentially expressed genes measured by total nuclear RNA-seq are shown at the bottom, color- coded according to the allele showing the highest expression value (musculus = black, light blue = castaneus). These two exemplary loci illustrate the strongest differences in RT associated with a measurable difference in gene expression. This association with transcription differences was not seen for most asynchronous regions (see text for details).


