
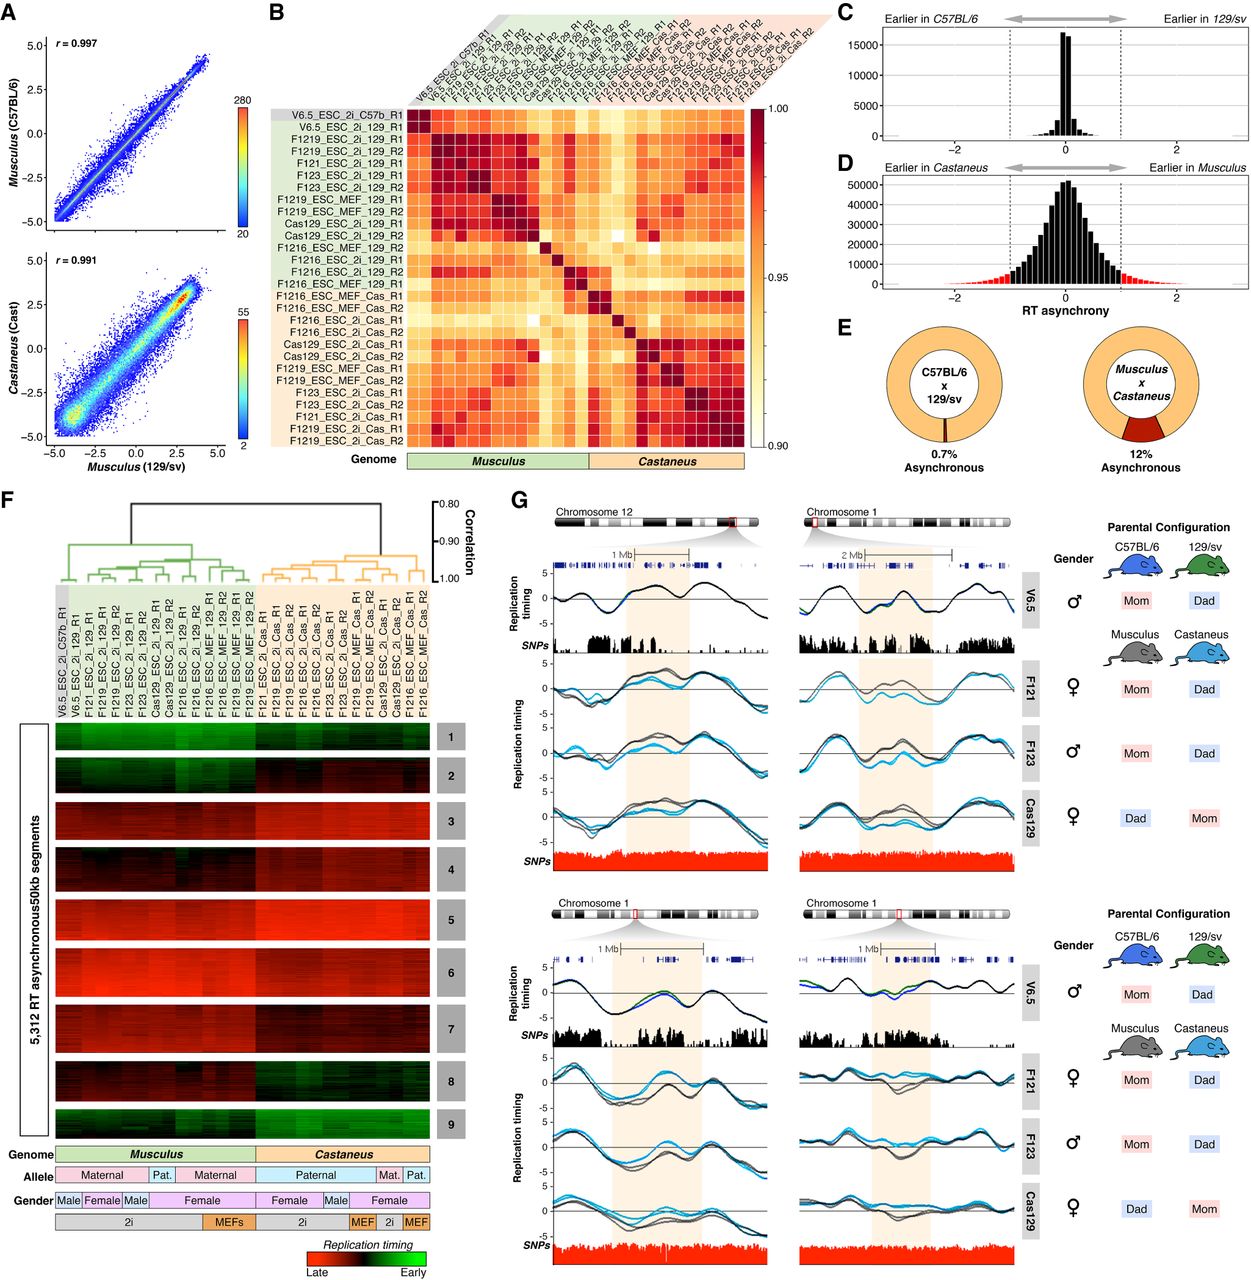
Replication timing asynchrony in hybrid mouse ESCs. (A) Genome-wide correlations of RT between alleles for hybrid ESC lines V6.5 (top panel) and F1219 (bottom panel). RT values of 50-kb windows are displayed as binned scatter plots with a density heat map. (B) Correlation matrix of allele-specific RT separates samples by genome. Data from all cell lines (V6.5, F121, F1216, F1219, F123, Cas129) were analyzed and arranged based on their correlation values. (C,D) RT asynchrony in V6.5 and castaneus × musculus mESC lines. Histogram of RT differences between C57BL/6 and 129/sv (C) and between 129/sv and CAST/Ei genomes (D) are shown. (E) Percentages of autosomal genome showing RT asynchrony in C57BL/6 × 129/sv and musculus × castaneus are shown. Asynchrony was defined as differences >80 min in S-phase. (F) Unsupervised clustering analysis of RT asynchronous chromosomal segments identified specific RT signatures. Heat map shows the RT ratios [=log2(Early/Late)]. Branches of the dendrogram were constructed based on the correlation values (distance = correlation value − 1), and a correlation threshold of 0.9 was used to define two main sample clusters. k-means clustering analysis of RT asynchronous regions defined RT signatures with specific patterns. Specific genomes, parental configuration, gender, and growth conditions are shown at the bottom. (G) RT profiles of exemplary genomic regions showing RT asynchrony between alleles. Cell lines are labeled at the right in gray boxes; SNPs between C57B/6 vs. 129/sv and 129/sv vs. CAST/Ei are shown in black and red peak tracks, respectively. C57B/6 alleles are shown as green lines, 129/sv alleles as gray lines, and castaneus as blue lines. Two replicates of each cell line are shown in each plot, and the gender and parental configuration of each hybrid mESC line are shown.


