
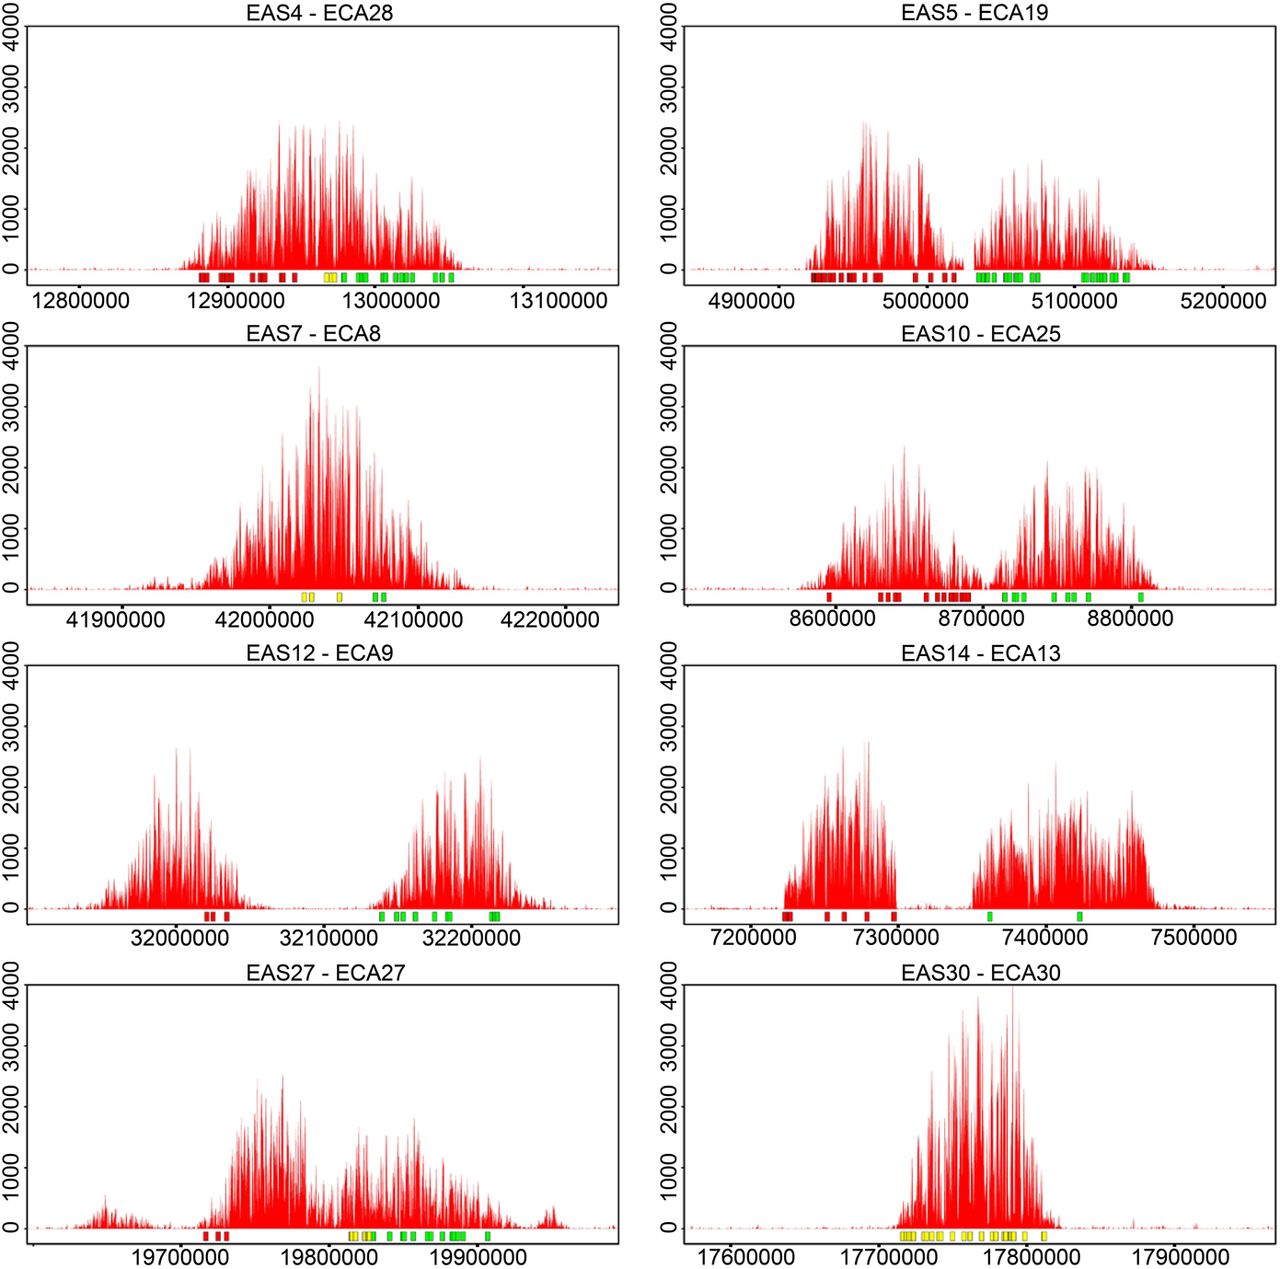
Figure 3.
Identification of epialleles through SNV analysis. The positions of single nucleotide variants (SNVs), located within each centromeric domain, are represented as colored rectangles under each ChIP-seq profile. Reads were mapped on the chimeric EquCabAsiA reference genome. The y-axis reports the normalized read counts, and the x-axis reports the genomic coordinates. Red or green rectangles indicate positions where only one nucleotide variant was enriched in the immunoprecipitated reads, and yellow rectangles indicate positions where both SNVs were present.


