
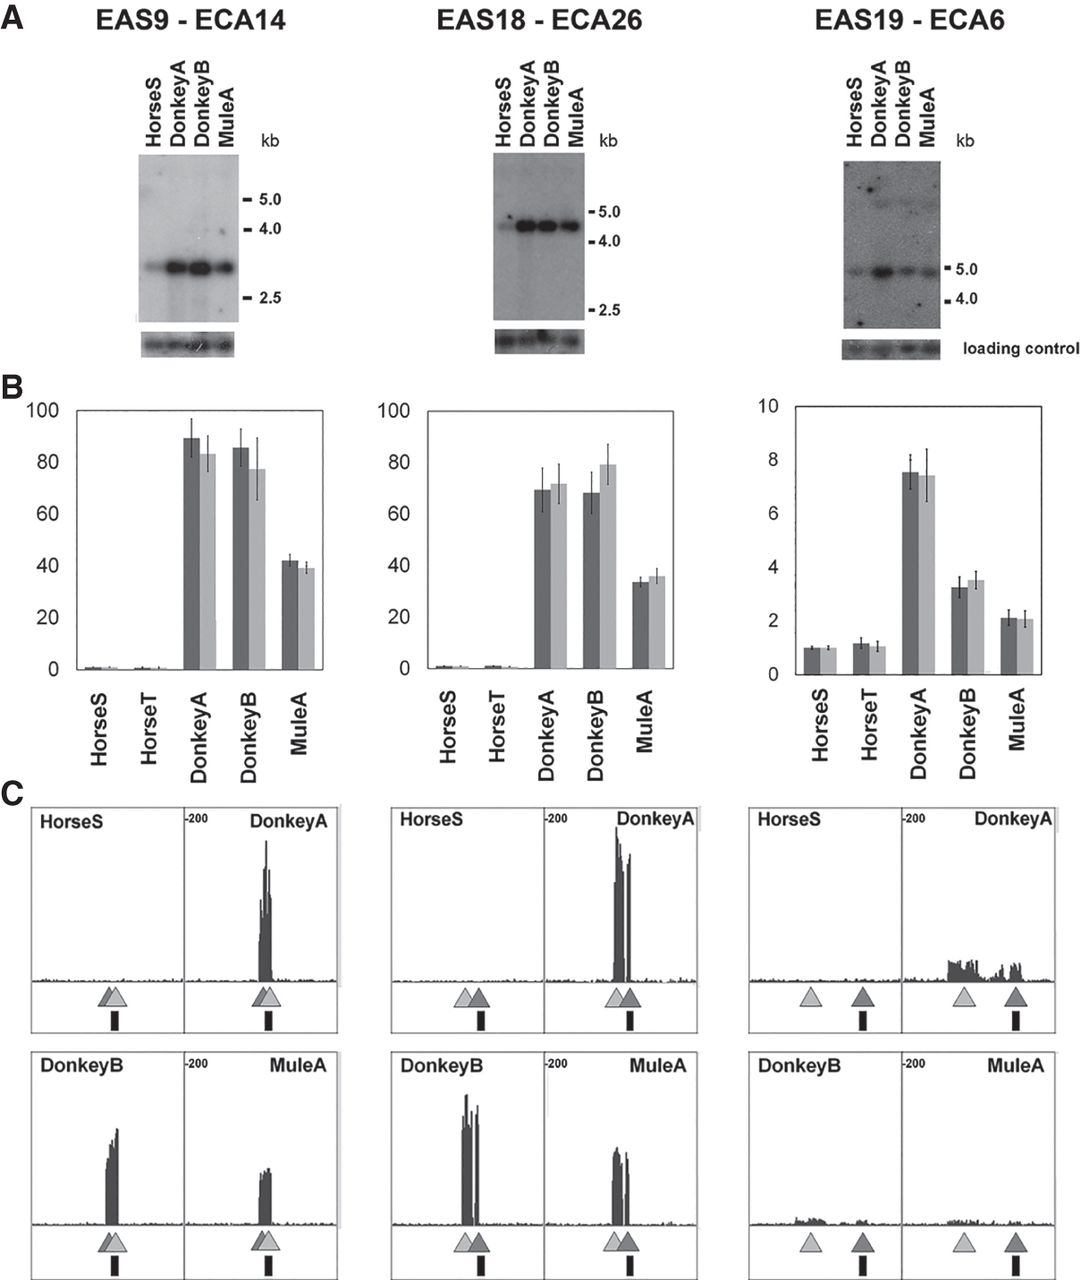
DNA sequence amplification at the centromeres of E. asinus Chromosomes 9, 18, and 19. The number of the E. asinus chromosome (EAS) and of its ortholog in E. caballus (ECA) is reported on top. (A) Southern blot analysis of genomic DNA from one horse, two donkeys, and a mule (MuleA, offspring of DonkeyB). The probes were obtained by PCR-amplification of a portion of the unit repeated in the donkey (Supplemental Table S4). Map positions of the probes are indicated as vertical black rectangles in C. (B) Quantitative PCR performed on DNA from two horses, two donkeys, and one mule. Each centromere was analyzed with two primer pairs (dark and light gray bars) (Supplemental Table S4). (C) Profile of input reads from one horse, two donkeys, and one mule aligned on the horse reference genome. The genomic regions shown are 29,593,109–29,725,206 for Chromosome 9; 22,441,448–22,572,314 for Chromosome 18; and 14,157,787–14,289,525 for Chromosome 19. Peaks represent regions amplified in the donkey genome compared to the horse genome. Light and dark gray triangles indicate the location of the fragments amplified in the quantitative PCR assay (B).


