
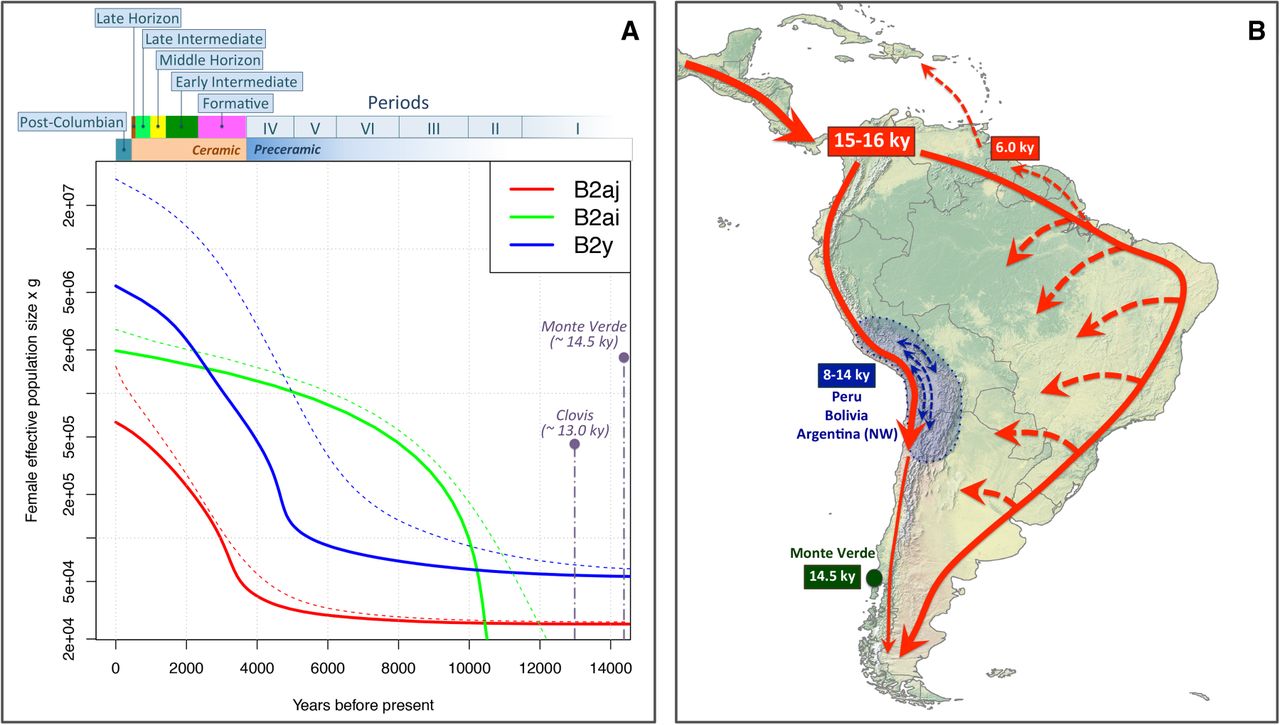
Figure 7.
(A) EBSP analysis of the mtDNA lineages explored in the present study. The figure shows the population growth experienced during the main prehistorical periods of the South American settlement. The EBSP of B2y considers only mtDNAs observed in South America. (B) Demographic scenario for the peopling of South America as suggested by the results of the present study.


