
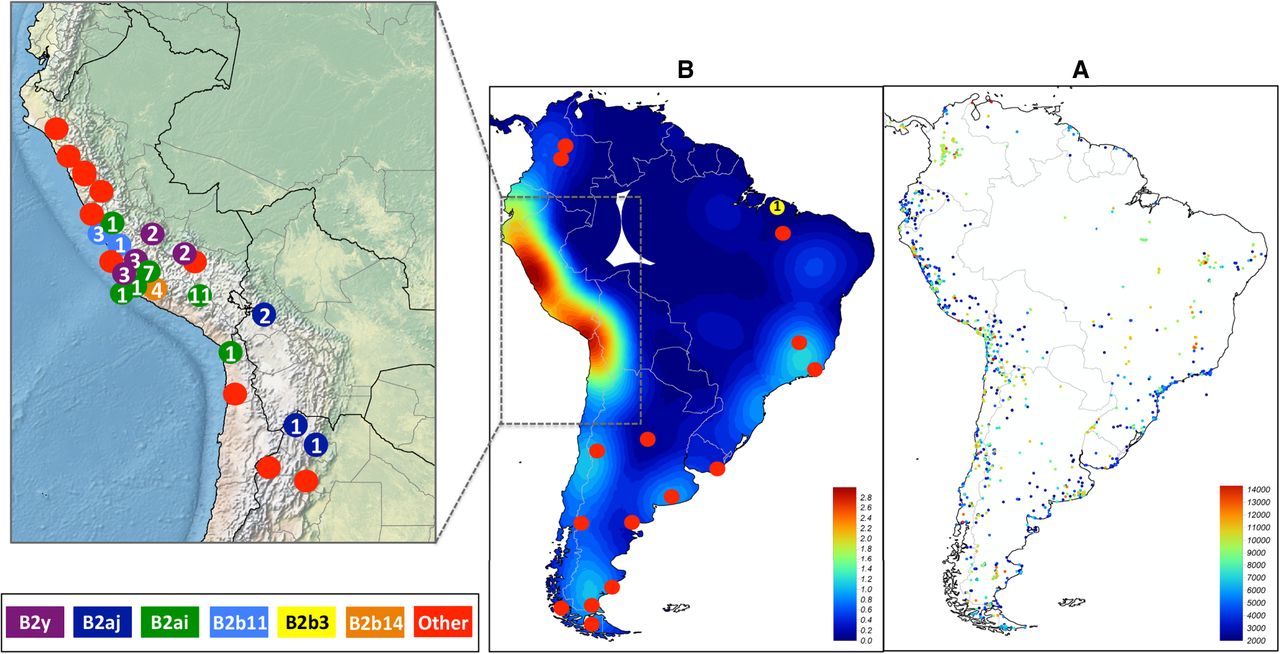
Figure 6.
(A) Age in years (see colored legend inset) and location of archaeological sites in South America according to Goldberg et al. (2016). (B) Interpolated kernel density map (units are expressed as the square decimal degree) from the archaeological data in Goldberg et al. (2016); dots indicate the sampling points of ancient specimens and the availability of mtDNA data. While red dots indicate mtDNA lineages other than those analyzed in the present study, other colors signal the presence and number of the B2 lineages analyzed here (see the legend inset).


