
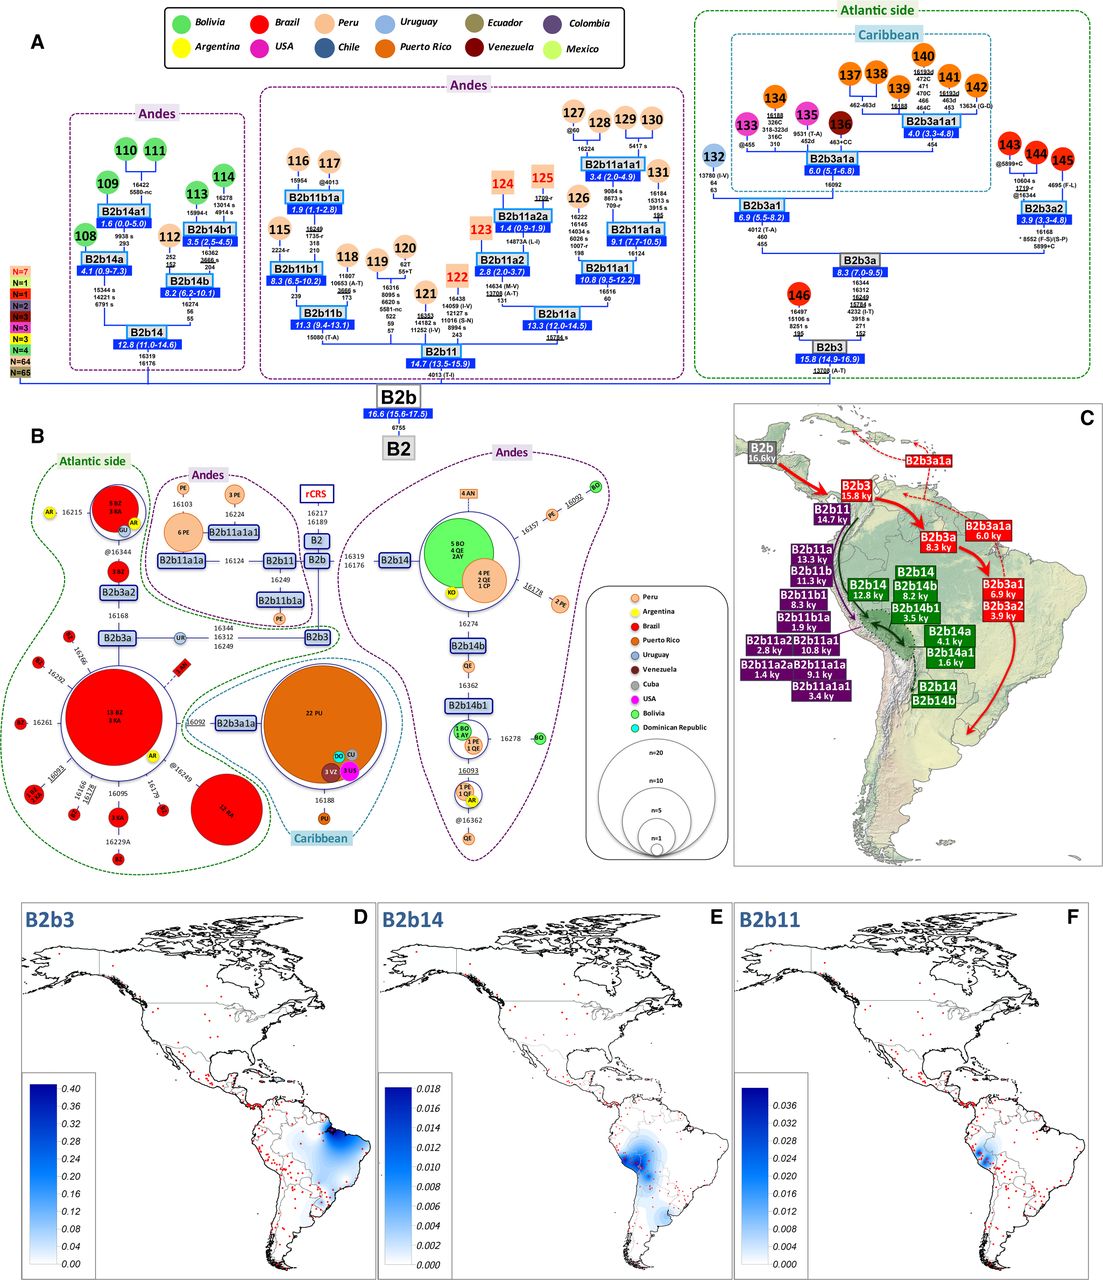
(A) Maximum parsimony tree of Bb3, B2b11 and B2b14 complete mitogenomes. An asterisk as prefix indicates a position located in an overlapping region shared by two mtDNA genes. For the sake of clarity, the mitogenomes belonging to B2b (× B2b3, B2b11, B2b14) are simply indicated as rectangles in the left side of the tree without accounting for their phylogeny (listed in Supplemental Table S11); the colors of rectangles indicate the geographic origin (as shown in the legend), and the inner numbers correspond to the number of detected mitogenomes. (B) Phylogenetic network of B2b3, B2b11, and B2b14 CR haplotypes obtained from population surveys (listed in Supplemental Table S2). (C) Main migration routes of B2b, B2b3, B2b11, and B2b14 as inferred from phylogeographic data. (D) Interpolated frequencies of B2b3 mtDNAs in America. (E) Interpolated frequencies of B2b14 mtDNAs in America. (F) Interpolated frequencies of B2b11 mtDNAs in America. See the legend of Figure 1 for more details on the phylogenies of panels A and B.


