
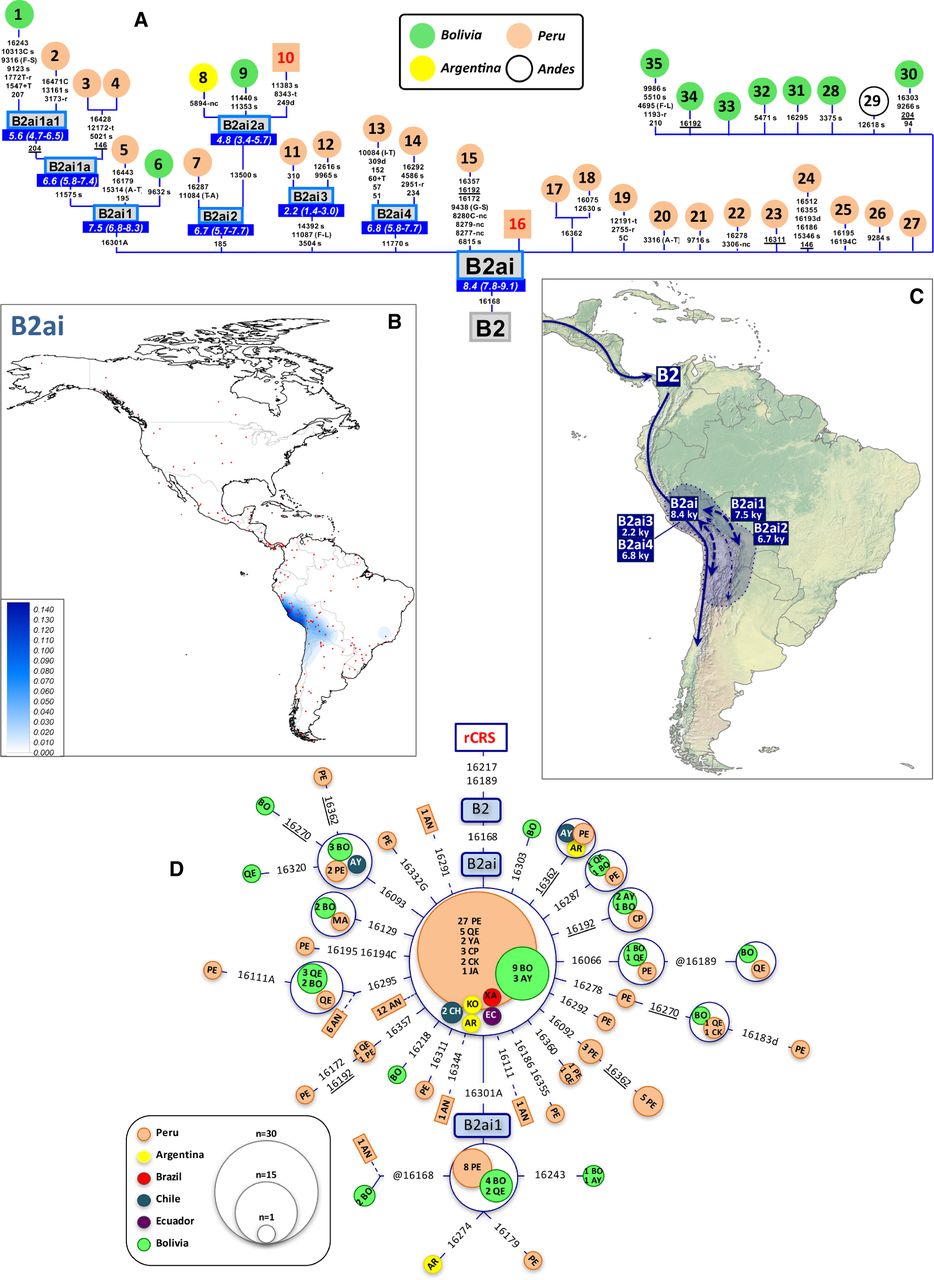
(A) Maximum parsimony tree of B2ai complete mitogenomes. ML coalescence ages (in ky) are shown below haplogroup names. (B) Interpolated frequencies of B2ai mtDNAs in America; red dots indicate sampling points. (C) Main migration routes of B2ai as inferred from phylogeographic data. (D) Network of B2ai CR haplotypes obtained from population surveys (listed in Supplemental Table S2). The position of the revised Cambridge reference sequence (rCRS) is indicated for reading sequence motifs. In panels A and D, mtDNA mutations are indicated along the branches of the phylogenies; they are transitions unless a suffix A, C, G, or T is included to indicate a transversion. Other suffixes indicate: insertions (+), synonymous substitutions (s), mutational changes in tRNA (-t), mutational changes in rRNA (-r), and noncoding variants located in the mtDNA coding region (-nc). Amino acid replacements are in round brackets, underlined mutations indicate homoplasies in the same tree, while the prefix “@” indicates a back mutation. Haplotypes from ancient samples are in boxes (and red numbers), while haplotypes from present-day samples are in circles. Geographic and/or ethnic origins of the mitogenomes in panel A are provided in Supplemental Table S5, while the two-letter codes inside circles in panel D refer to ethnic origins (according to Supplemental Table S2), with numbers indicating the number of mtDNAs. Boxes with blue borders in panel A indicate sub-haplogroups that are new relative to the reference phylogeny in PhyloTree Build 17. Mutational hotspot variants at positions 16182, 16183, and 16519, as well as variation around position 310 and length or point heteroplasmies were not considered for the phylogenetic reconstruction. Mitochondrial DNA sequence data for comparisons, phylogenetic trees, and maps of interpolated frequencies were obtained from the literature (Supplemental Table S10).


