
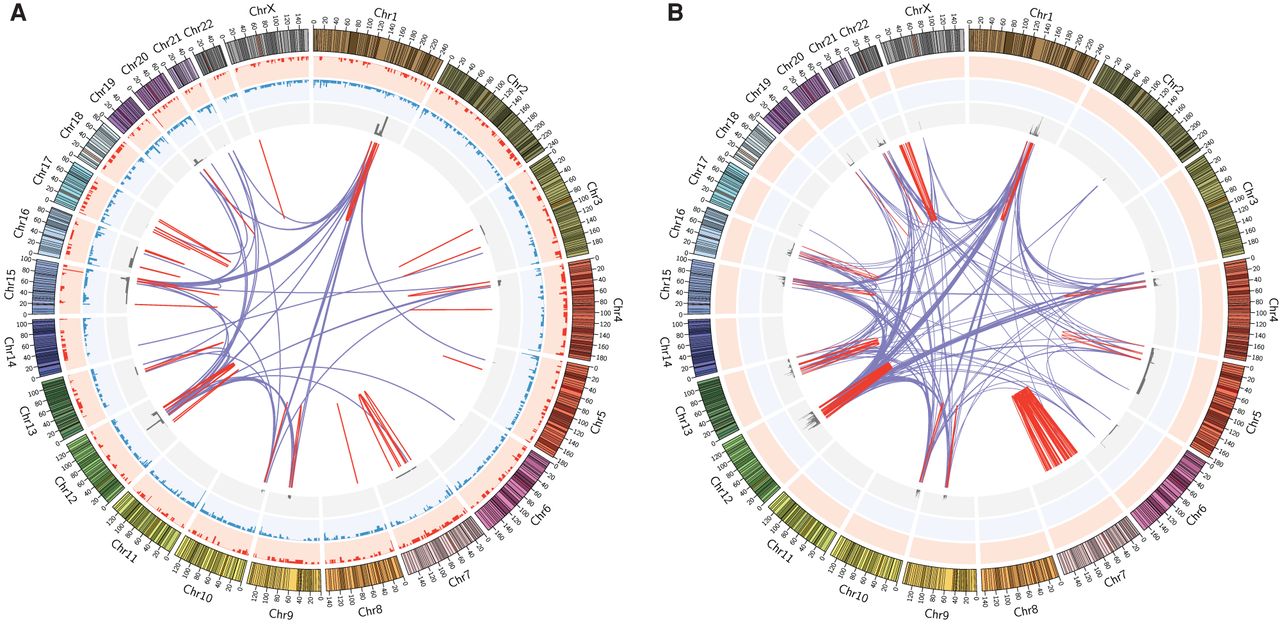
Circos plots of genomic variations in cell line 778. (A) Circos plot derived from whole-genome mapping of the cell line. (B) Circos plot derived from short-read sequencing of two neochromosome isoforms, using data from Garsed et al. (2014). For both plots, moving inward from the outer ideogram are histograms of deletions (>1 kb; red) and insertions (>1 kb; blue) in the background genome. For the neochromosome Circos plot (B), these two tracks are only placeholders, as the background genomes were not sequenced in the original study. The next track, in gray, shows copy number profiles of the fusion maps (A) and neochromosomes (B). Linked lines in the middle of the Circos plots show complex genomic rearrangements: red for intra-chromosomal and purple for inter-chromosomal translocations. Plots were generated using the Circos visualization tool (Krzywinski et al. 2009).


