
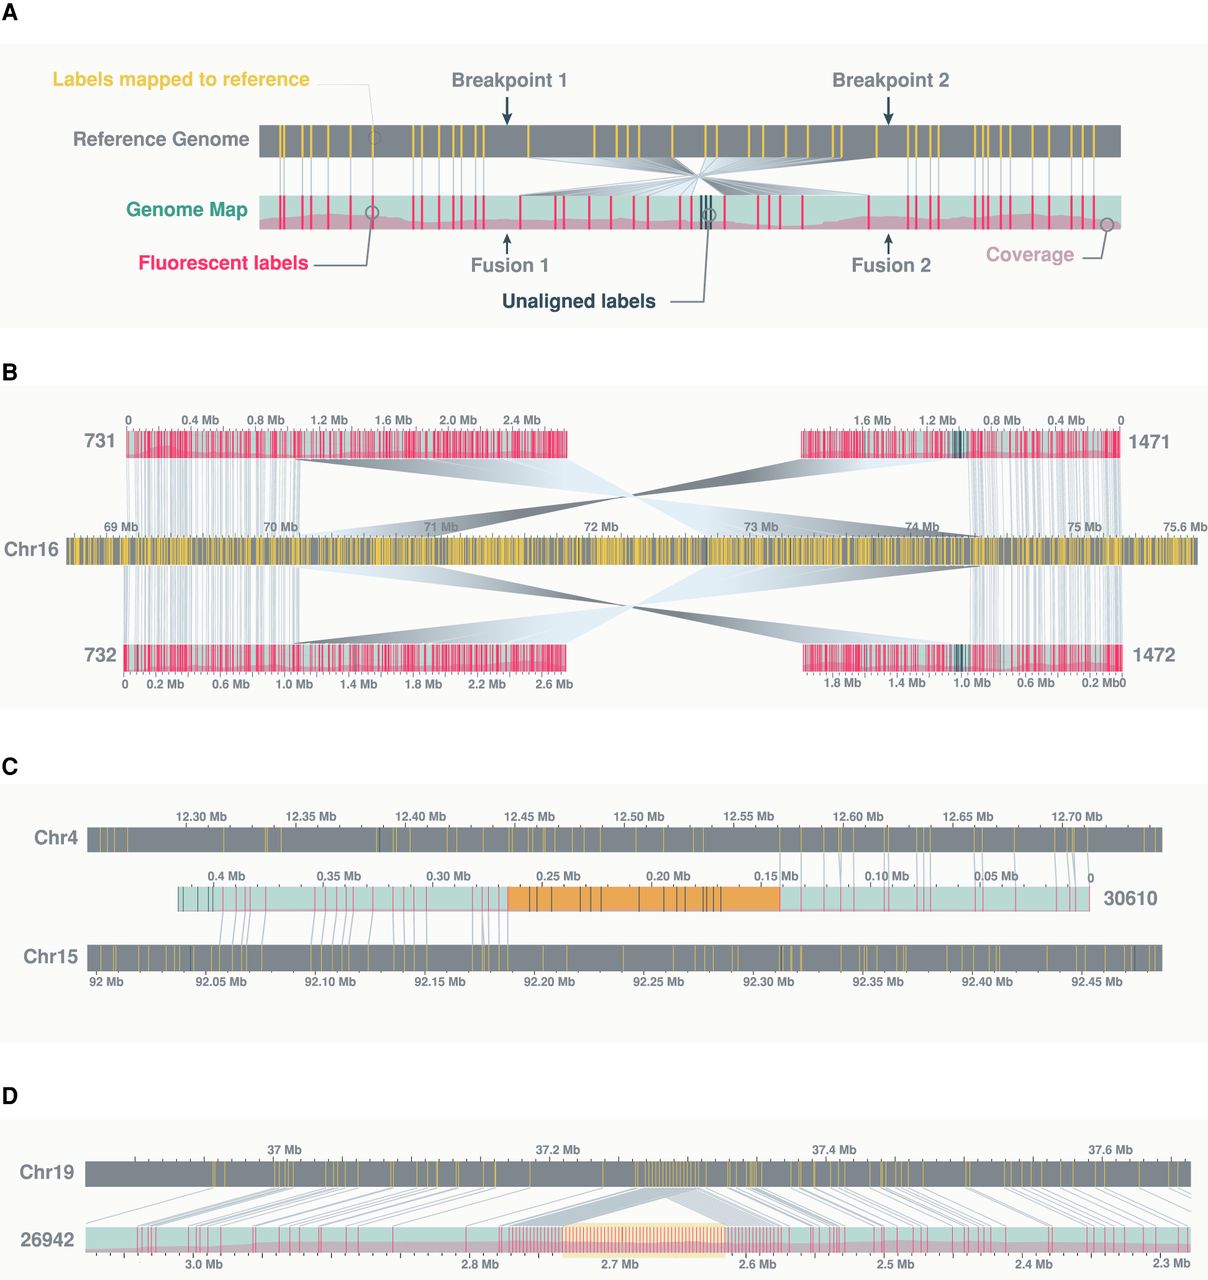
Examples of structural variants. (A) A schematic showing a genomic inversion as characterized by two breakpoints in the reference genome and two fusion junctions in the rearranged genome. (B) An example of a fully resolved 4-Mb inversion, characterized by two pairs of optical maps, each carrying one fusion junction with flanking fragments aligning in opposing directions to one side of the two reference breakpoints. (C) An example of a translocation between Chromosomes 4 and 15, showing “complex” label patterns at the rearrangement junction (highlighted in orange). (D) An example of a 159-kb insertion, showing “repeat” label patterns of the inserted fragment (highlighted in yellow). In this case, the repeat corresponds to the SST1 satellite. Additional examples highlighting complex label patterns at translocation junctions relative to repetitive label patterns of insertions can be found in Supplemental Figure S7. The schema in this figure follows the same convention as outlined in Figure 1. Matching labels between sample and reference genome maps are connected by gray lines. For clarity, any additional genome maps aligning to the reference regions of interest are hidden from view.


