
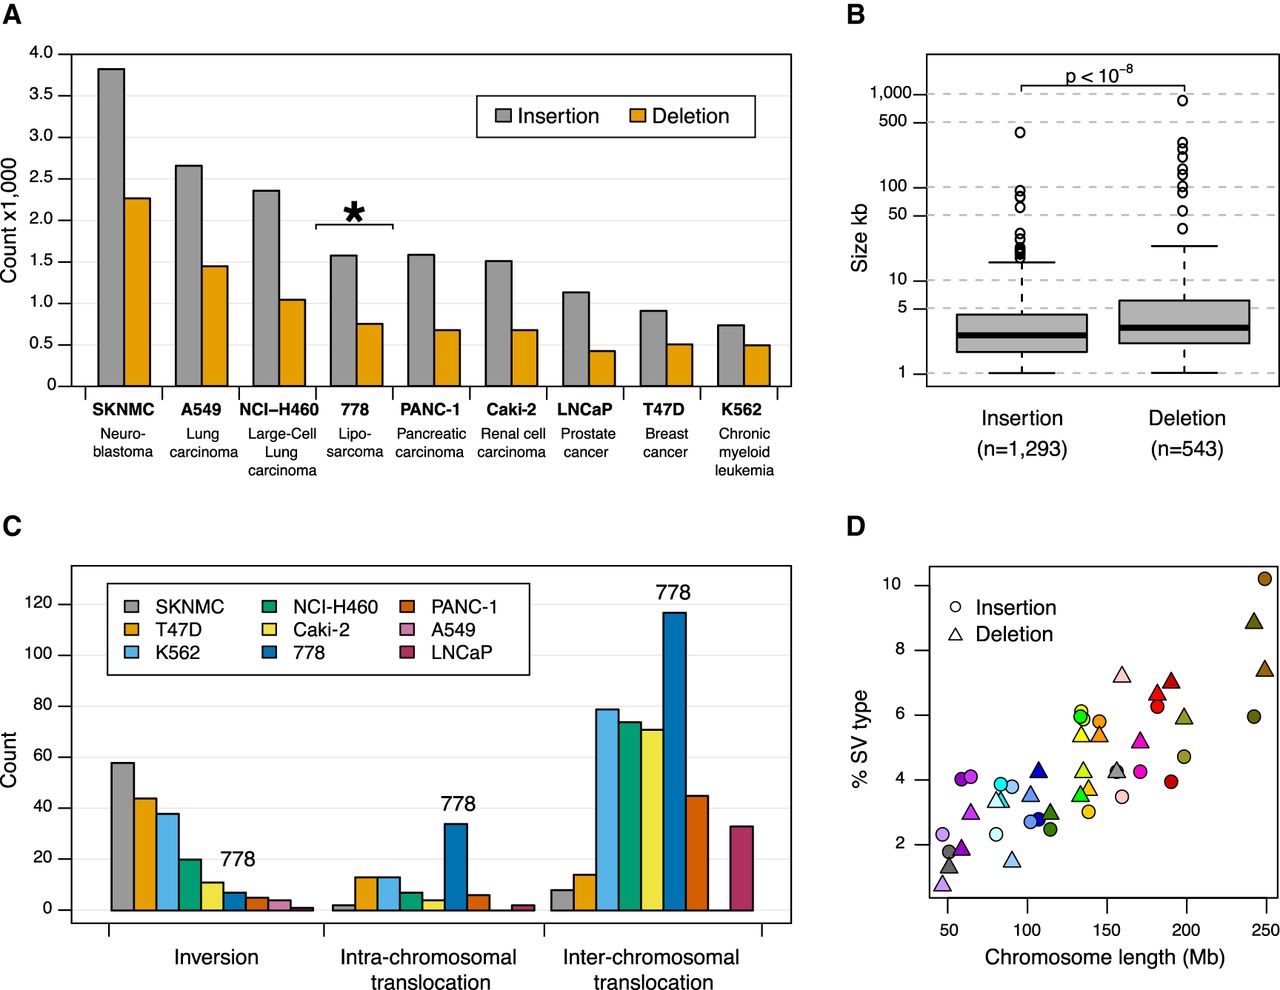
Structural variations identified using whole-genome optical mapping. (A,C) Comparison of large SVs identified in liposarcoma cell line 778 with eight other cancer cell lines reported in Dixon et al. (2017). All SVs from both studies were determined using the Bionano Irys optical mapping system. A shows the typical 1.5- to 2.7-fold more insertions relative to deletions with cell line 778 highlighted with an asterisk (*), whereas C shows cell line 778 harbors much more intra- and inter-chromosomal translocations relative to other cancer cell lines. (B) Box plot showing a statistically significant difference between deletion and insertion sizes, for SVs >1 kb. Thick black horizontal lines in the middle of the box plots correspond to median values, whereas shaded gray boxes encompass the interquartile ranges. (D) The proportions of large insertions and deletions found in cell line 778 are correlated with chromosome length.


