
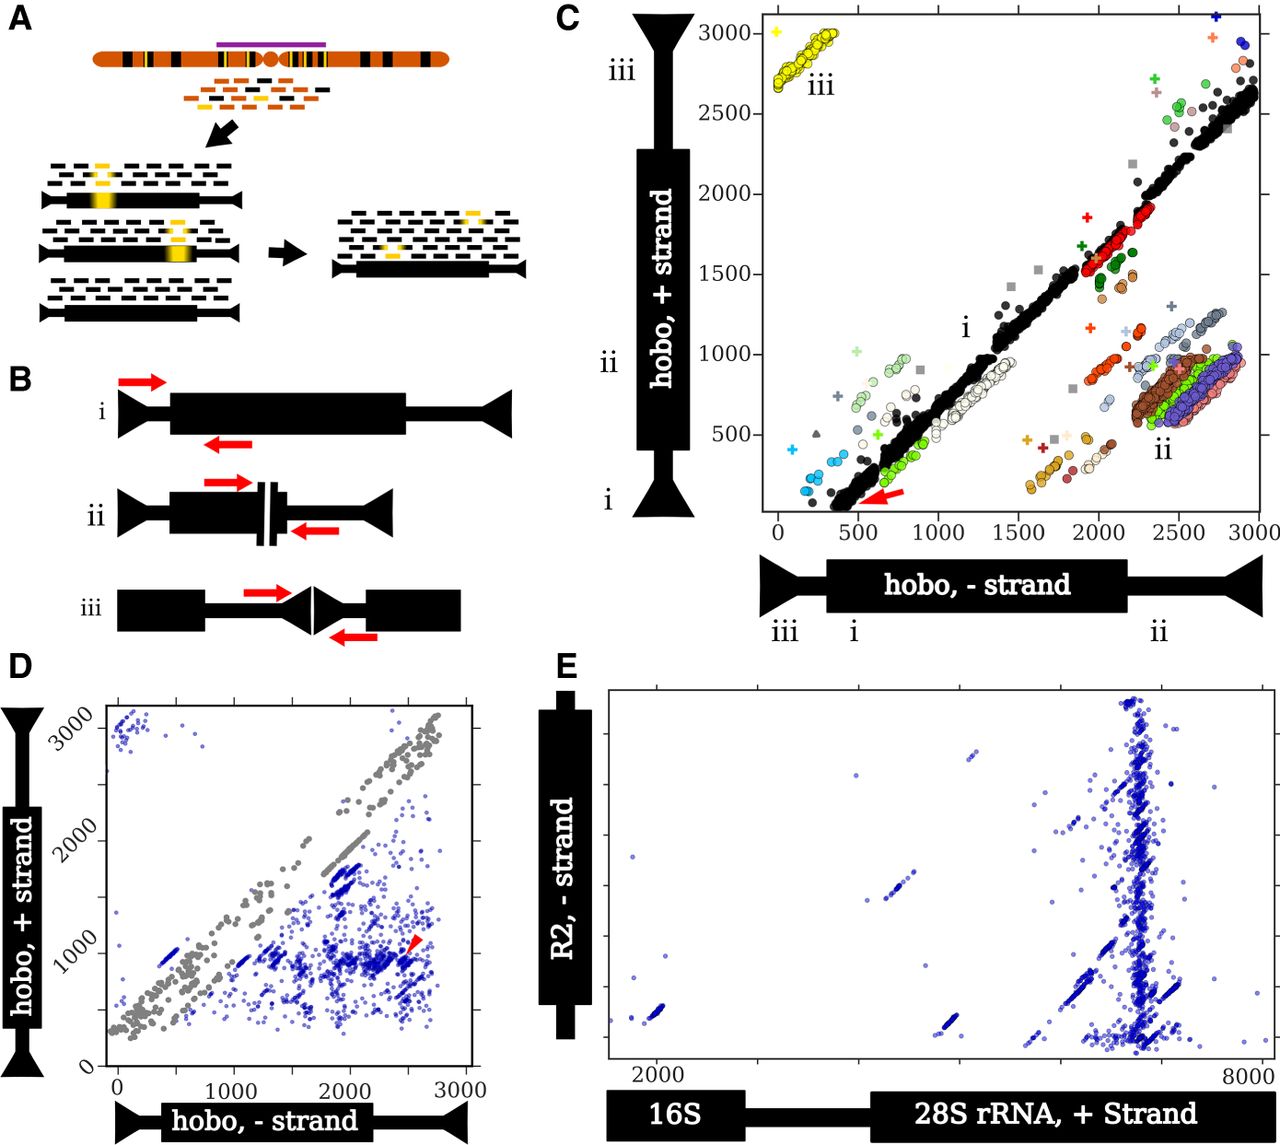
An outline of the ConTExt pipeline and examples of identified structures. Thin and thick bars of repeats represent noncoding and coding sequences, respectively. (A) Reads are derived from genomic DNA, with many copies of a particular repeat family (black) dispersed among single-copy sequence (orange); some repeat copies have polymorphisms relative to the consensus (yellow bars), especially those in heterochromatin (purple bar). The reads are aligned to individual repeats identified in the reference genome, including divergent elements; three examples are shown. Alignments to these individual elements are then collapsed onto a consensus sequence for that repeat family. Inverted arrowheads indicate short terminal inverted repeats (TIRs) that are common to many DNA transposons. (B) Schematics of paired-end reads spanning sequence concordant with the consensus (i), the junction of an internal deletion (ii), and the junction of a head-to-tail tandem (iii). (C) A two-dimensional scatterplot of paired-end alignments from strain I03 to the hobo element. Each dot represents a single read pair. Its position on the x- and y-axes corresponds to the 3′ ends of the reads aligning to the minus and plus strands of the hobo consensus, respectively. For example, the red arrow indicates a read pair where the 5′ end of the forward read aligns to the beginning of the consensus (as in panel B,i). Both reads are 70 bp and the gap is 330 bp, so the corresponding dot is located at position 70 on the y-axis (the location of the 3′ end of the forward read) and at position 400 on the x-axis (70 + 330). The Roman numerals indicate how the three types of structures shown in B correspond to patterns in the scatter plot and where the reads map on each of the axes. (i) Concordant reads (black dots) that form the main diagonal. (ii) Reads spanning internal deletions. (iii) Reads spanning head-to-tail tandem junctions. The nonblack colors correspond to nonconcordant clusters identified by the EM algorithm, and gray squares are potential artifacts. The plus symbols are the estimated junction for the cluster with the corresponding color. Note that some colors are used twice to indicate distinct widely separated clusters. Read pairs where both ends map to the same strand (e.g., head-to-head tandems) require a different scatterplot to detect. (D) A scatter plot of all junctions involving hobo across all GDL strains. Each dot represents a junction estimated from a cluster in a specific strain (the plus symbols in C). The red arrowhead indicates the location of the deletion identified previously in the Th hobo variant (Periquet et al. 1994). At some rate, concordant read pairs are misclassified as discordant and may generate spurious junctions along the main diagonal; we excluded these from the analysis (see Methods, “Categorizing Tandem Junctions”) and colored these junctions in gray. (E) A scatter plot depicting all junctions across all GDL strains between the minus-strand of the R2 retrotransposon and the plus-strand of rDNA. The thick black bar on the rDNA schematic represents the transcribed rRNAs. The first ∼1500 bp of the rDNA cistron is not shown because only a few low-frequency R2 junctions are present there. The plot successfully identifies that most R2 insertions occur at the same position in the 28S rDNA subunit, as previously demonstrated (Kojima and Fujiwara 2005; Stage and Eickbush 2009).


