
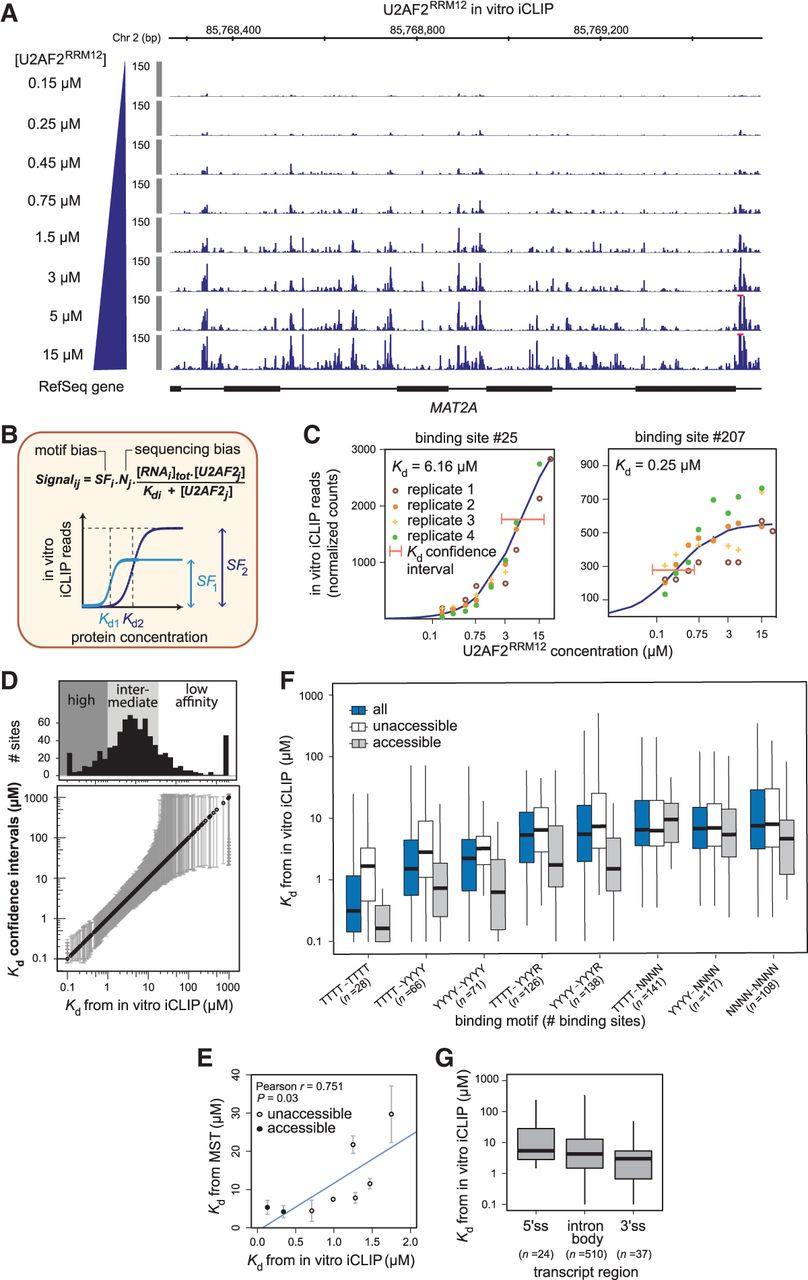
Binding site affinities can be extracted from in vitro iCLIP titration experiments. (A) Titration experiments with increasing U2AF2RRM12 concentrations (0.15–15 µM). Genome browser view of normalized U2AF2RRM12 in vitro iCLIP signal in MAT2A. Red bars indicate values beyond the displayed data range. (B) Kd values were extracted by modeling the read counts from in vitro iCLIP as a function of RNA and U2AF2RRM12 concentrations. A scaling factor (SF) and a normalization factor (N) account for motif and sequencing biases, respectively. Schematic titration curves show two binding sites with lower or higher affinity and/or crosslinking efficiency (dark or light blue, respectively). (C) Titration curves for an intermediate-affinity (left) and a high-affinity binding site (right) (numbers above relate to Supplemental Table S2). Best-fit curves (dark blue) and confidence intervals for the estimated Kd values (orange lines) based on four replicate experiments. (D, lower panel) Plot showing all Kd values from in vitro iCLIP in increasing order (black circles) with their confidence intervals (gray lines). (Upper panel) Histogram of binding sites along the range of Kd values. Binding sites were divided into 120 high-affinity binding sites (Kd < 1 µM), 513 intermediate-affinity sites (1 ≤ Kd ≤ 18 µM), and 162 low-affinity sites (Kd > 18 µM). (E) Kd values from in vitro iCLIP are correlated with microscale thermophoresis (MST) measurements for eight selected binding sites (Supplemental Table S3). Binding sites are marked as accessible (gray) or unaccessible (white) based on RNA fold predictions (see Methods). Pearson correlation coefficient (r) and associated P-value indicated above. (F) Kd values from in vitro iCLIP are proportionate to the underlying pyrimidine content. Binding sites were stratified based on different 8-mers within a 17-nt window (blue; number of binding sites within each category in brackets), and further subdivided into unaccessible (white) or accessible (gray) as in F. (G) Affinities at 3′ splice sites do not significantly differ from other transcript regions. Bar plot showing the distribution of Kd values from in vitro iCLIP for U2AF2 binding sites in different transcript regions.


