
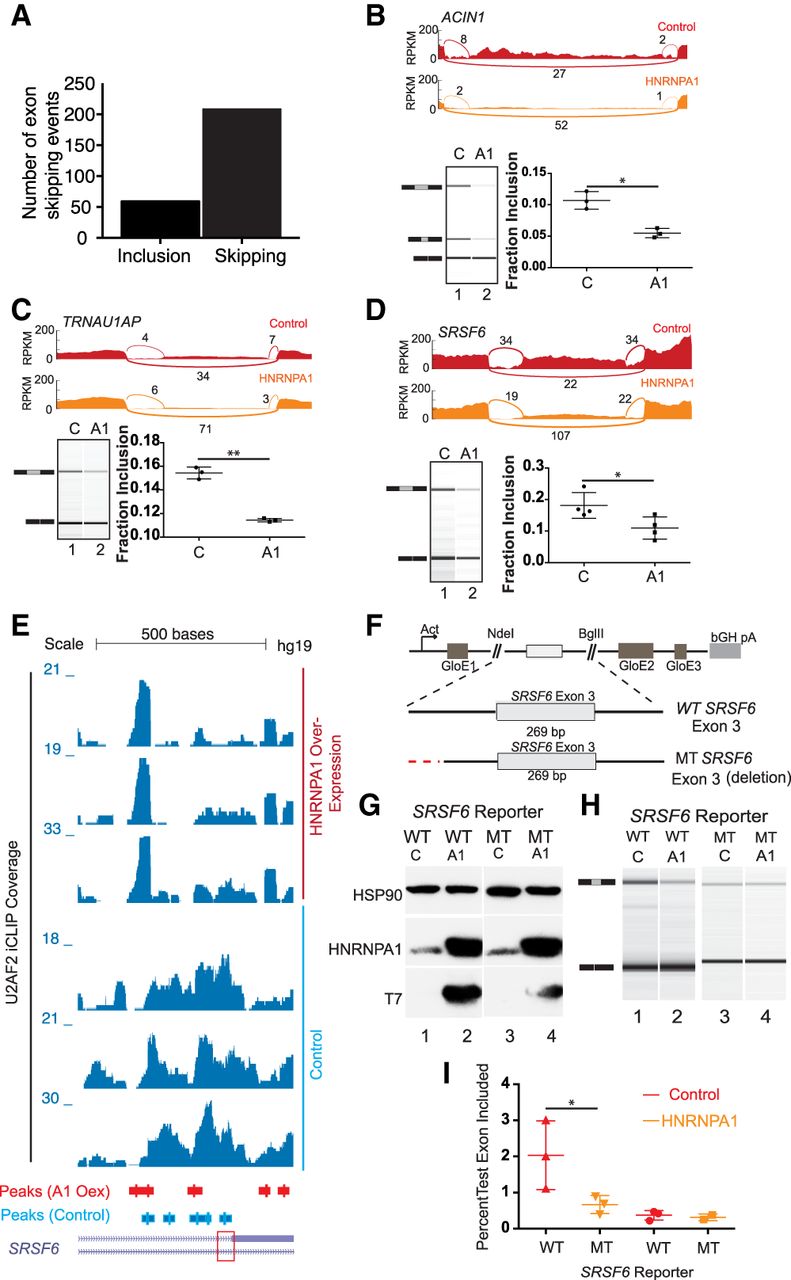
Noncanonical U2AF2 binding sites influence HNRNPA1-dependent exon skipping. (A) Bar graph of all HNRNPA1-dependent splicing changes as detected by MISO analysis. Events determined from the comparison of RNA-seq data derived from HNRNPA1 overexpressing HEK293T cell versus control HEK293T cells. (B–D) Sashimi plots showing read and junction coverage for three genes: ACIN1, SRSF6, and TRNAU1AP. Virtual gel representation of an Agilent 2100 Bioanalyzer DNA 1000 assay of RT-PCR products corresponding to endogenous ACIN1, SRSF6, and TRNAU1AP from control and HNRNPA1 overexpression cells (lower left panel). Bar graph depicting mean exon inclusion for TRNAU1AP and SRSF6 splicing reporters quantified using an Agilent 2100 Bioanalyzer with standard deviation bars. (*) P < 0.05; (**) P < 0.01 (lower right panel). (E) UCSC Genome Browser screen shot of U2AF2 iCLIP read coverage at the SRSF6 exon 3 locus in control or HNRNPA1 overexpression cells (bottom and top three tracks, respectively). Peaks called by CLIPper are depicted below the coverage tracks. Red box denotes the 3′ss of SRSF6 exon 3. (F) Splicing reporter constructs created representing wild-type (Wt) or mutant (Mt) versions of alternative exons in SRSF6. Noncanonical U2AF2 binding sites in SRSF6 were mutated (red lines) by deletion. GloE1, GloE2, and GloE3 designate exons 1–3 of beta-globin. The polyadenylation signal from the bovine growth hormone 1 gene is indicated by bGH pA. (G) Representative western blots probed with antibodies against HSP90, HNRNPA1, and the T7 epitope. Lysates were prepared from HEK293T cells transiently transfected with either wild-type (WT) or mutant (MT) SRSF6 reporter construct and control or T7 epitope–tagged HNRNPA1. (H) Virtual gel representation of an Agilent 2100 Bioanalyzer DNA 1000 assay of RT-PCR products from SRSF6 splicing construct transfections. (I) Bar graph depicting mean exon inclusion for SRSF6 splicing reporters quantified using an Agilent 2100 Bioanalyzer with standard deviation bars. (*) P < 0.05.


