
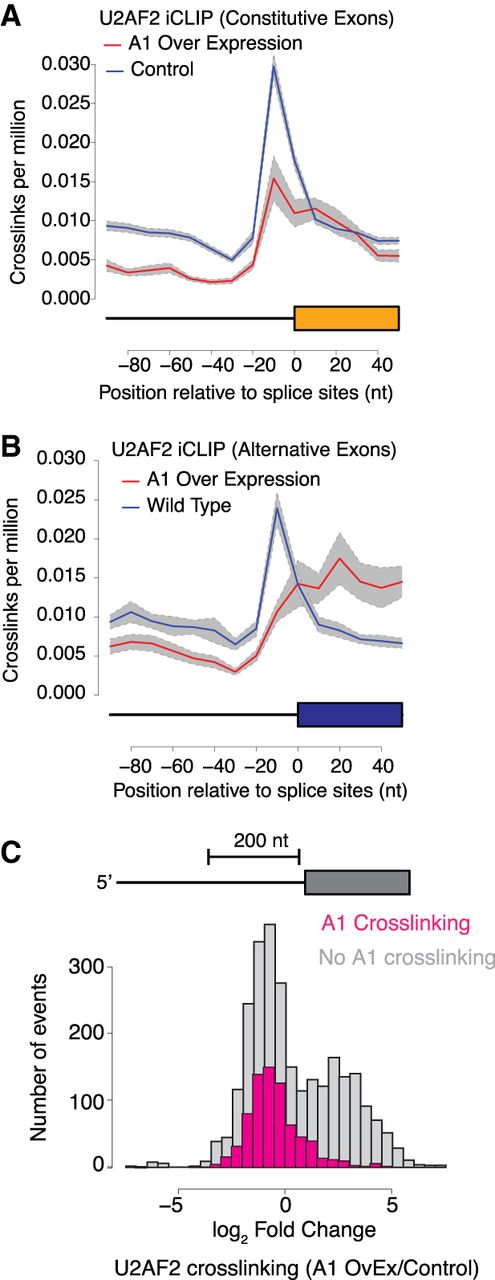
Figure 3.
HNRNPA1 induced redistribution of U2AF2 crosslinking near 3′ss. (A,B) Normalized crosslinking distribution for U2AF2 in wild-type (blue line) and HNRNPA1 overexpression cell lines (red line) with 95% confidence interval (gray area). Data are divided between constitutive (A) and alternative cassette (B) exons. (C) Distribution of U2AF2 crosslinking changes within 200-bp intron regions near 3′ss of alternative cassette exons. Gray bars correspond to annotated alternative splicing events with no evidence of HNRNPA1 crosslinking in either condition, and pink represents annotated events with detectable HNRNPA1 crosslinking.


