
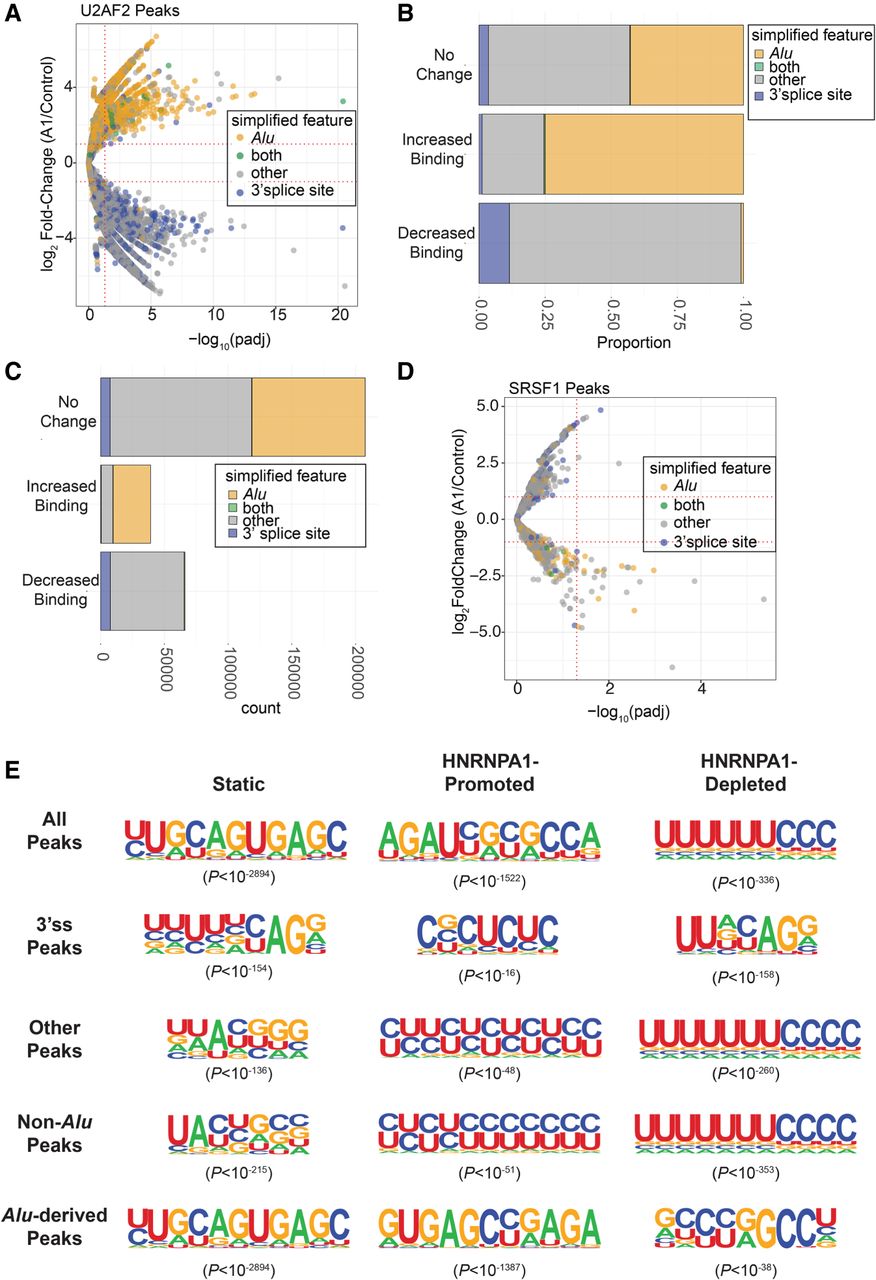
Analysis of global changes in U2AF2 binding site and consensus motifs in control and HNRNPA1 overexpression cells. (A) Volcano plot representing the log2(fold-change) in U2AF2 crosslinking peaks (HNRNPA1 overexpression/control) found within Alu elements, 3′ splice site regions, both Alu and 3′ splice site regions (both), or other regions outside of these (other). These fold-changes are plotted against their corresponding –log10(adjusted P-value) associated with each fold-change. Horizontal dotted lines are associated with a log2(fold-change) of ±2 and between HNRNPA1 overexpression versus control samples. Vertical dotted lines are associated with −log10(adjusted P-value) corresponding to 0.05. (B) Stacked bar graph showing the proportion of U2AF2 crosslinking peaks showing no change (top), increased crosslinking peaks (Increased Binding), or decreased crosslinking peaks (Decreased Binding) found within Alu elements, 3′ splice site regions, both Alu and 3′ splice site regions (both), or other regions outside of these (other). (C) Stacked bar graph showing the total count of U2AF2 crosslinking peaks showing no change (top), increased crosslinking peaks (Increased Binding), or decreased crosslinking peaks (Decreased Binding) found within Alu elements, 3′ splice site regions, both Alu and 3′ splice site regions (both), or other regions outside of these (other). (D) Volcano plot representing the log2(fold-change) in SRSF1 crosslinking peaks found within Alu elements, 3′ splice site regions, both Alu and 3′ splice site regions (both), or other regions outside of these (other). (E) HOMER-generated exemplar U2AF2 motifs associated with static (left), HNRNPA1-disrupted (middle), and HNRNPA1-promoted (right) crosslinking peaks at 3′ splice sites with HNRNPA1 overexpression. Associated P-values for each motif are provided in parentheses.


