
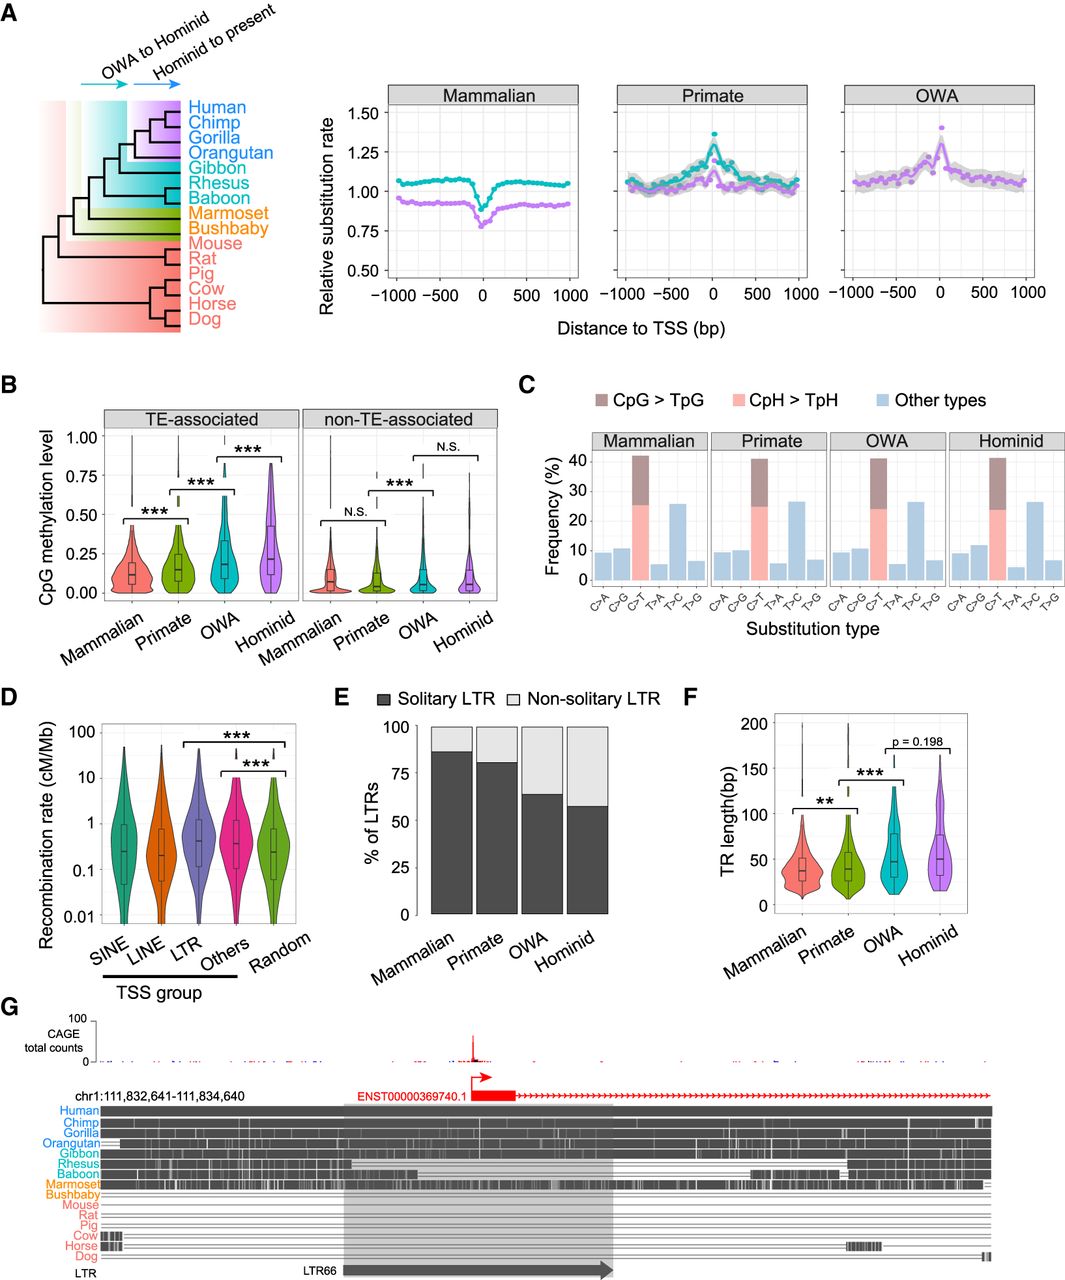
Rapid sequence evolution of young TSSs. (A) (Left) Phylogeny of genomes used for evolutionary rate analysis, with arrows indicating the two considered periods. (Right) Distributions of relative substitution rates (normalized by genomic average) inferred from genomic alignments for three TSS groups using 50-bp bins along TSS ± 1 kb. The curve colors correspond to the two periods highlighted in the phylogeny. Best-fit curves were estimated by “loess,” and gray shades indicate 95% confidence intervals. (B) Violin-box plots for germline DNA methylation levels (a male germline data set from Guo et al. 2015) for different TSS groups. For each TSS, the average methylation level of CpGs was calculated for TSS ± 1 kb. (C) Frequencies of nucleotide substitution types in different TSS groups, based on the data from the 1000 Genomes Project. (D) Violin-box plots of recombination rates among TSSs associated with different types of retrotransposons and random genomic background. The recombination rate of each TSS was defined as the average rate for TSS ± 1 kb. Background recombination rates were generated for randomly selected 2-kb windows in the human genome. (E) The fraction of solitary LTRs in four TSS groups. (F) Violin-box plots of tandem repeat (TR) lengths in the four TSS groups. (G) Genome browser view depicting a putative TSS death event around an LTR66 element in the lineages of rhesus and baboon. Statistical significances in B, D, and F were calculated by one-tailed Wilcoxon rank-sum tests. (**) P < 0.01, (***) P < 0.001, (N.S.) not significant.


