
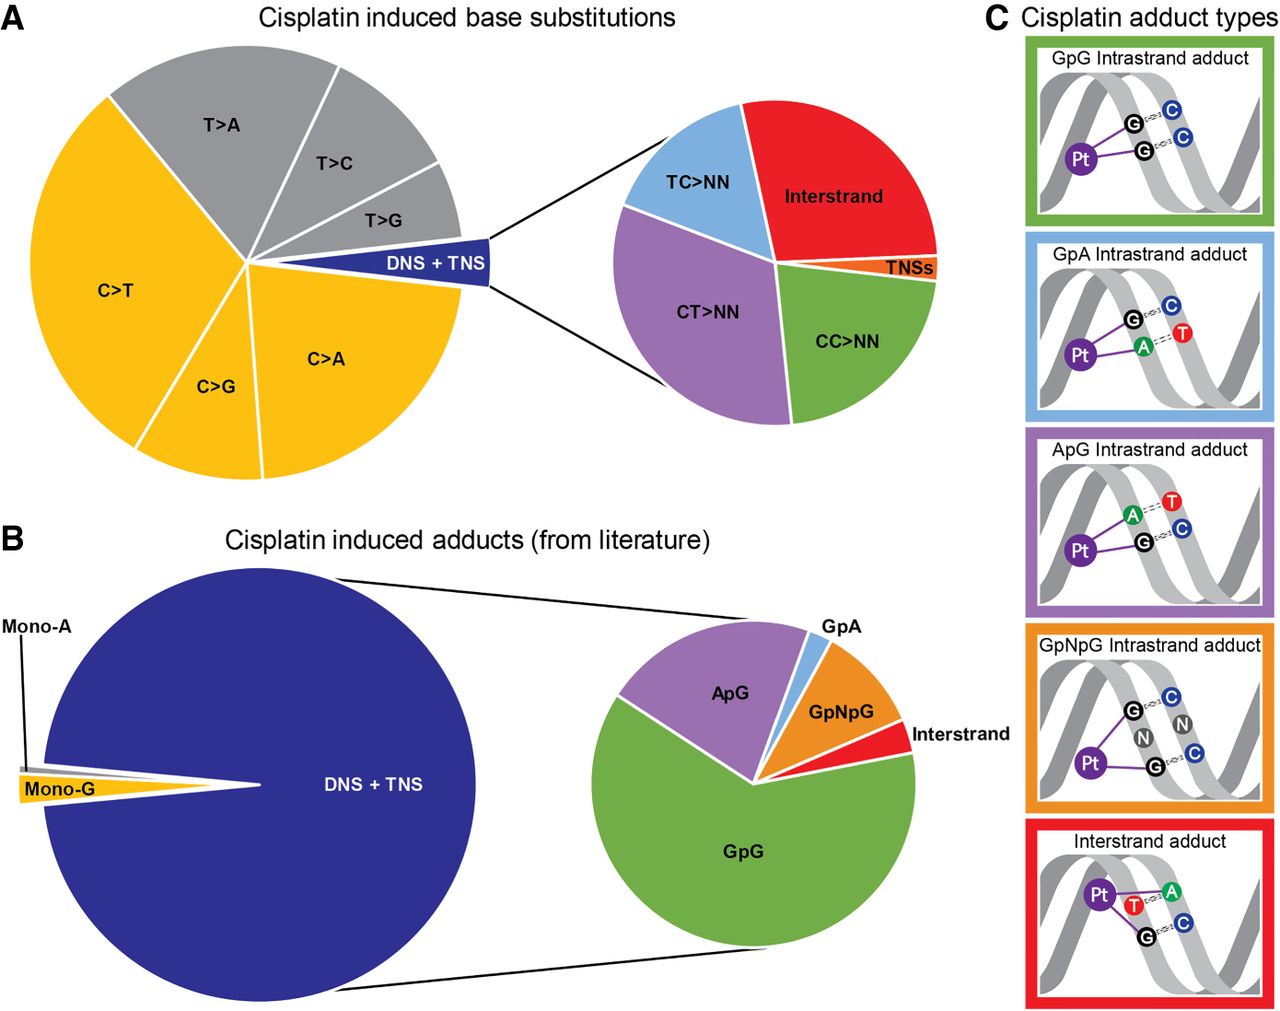
Comparison of proportions of cisplatin-induced substitutions and reported cisplatin-adducts. (A) Relative abundance of cisplatin-induced base substitutions in the experimental signature. TNS = trinucleotide substitutions. (B) Relative abundances of cisplatin-adducts from Eastman (1983), Fichtinger-Schepman et al. (1989), Jamieson and Lippard (1999), Baik et al. (2003), and Enoiu et al. (2012). Colors of mutations in A correspond to colors of the adducts they are expected to be caused by in B. (C) Schematic representations of adducts in B related to cisplatin-induced substitutions in A: The colors of the borders of the schematic adduct representation correspond to the colors used in the zoomed-in section of the pie-charts on the right sides of A and B.


