
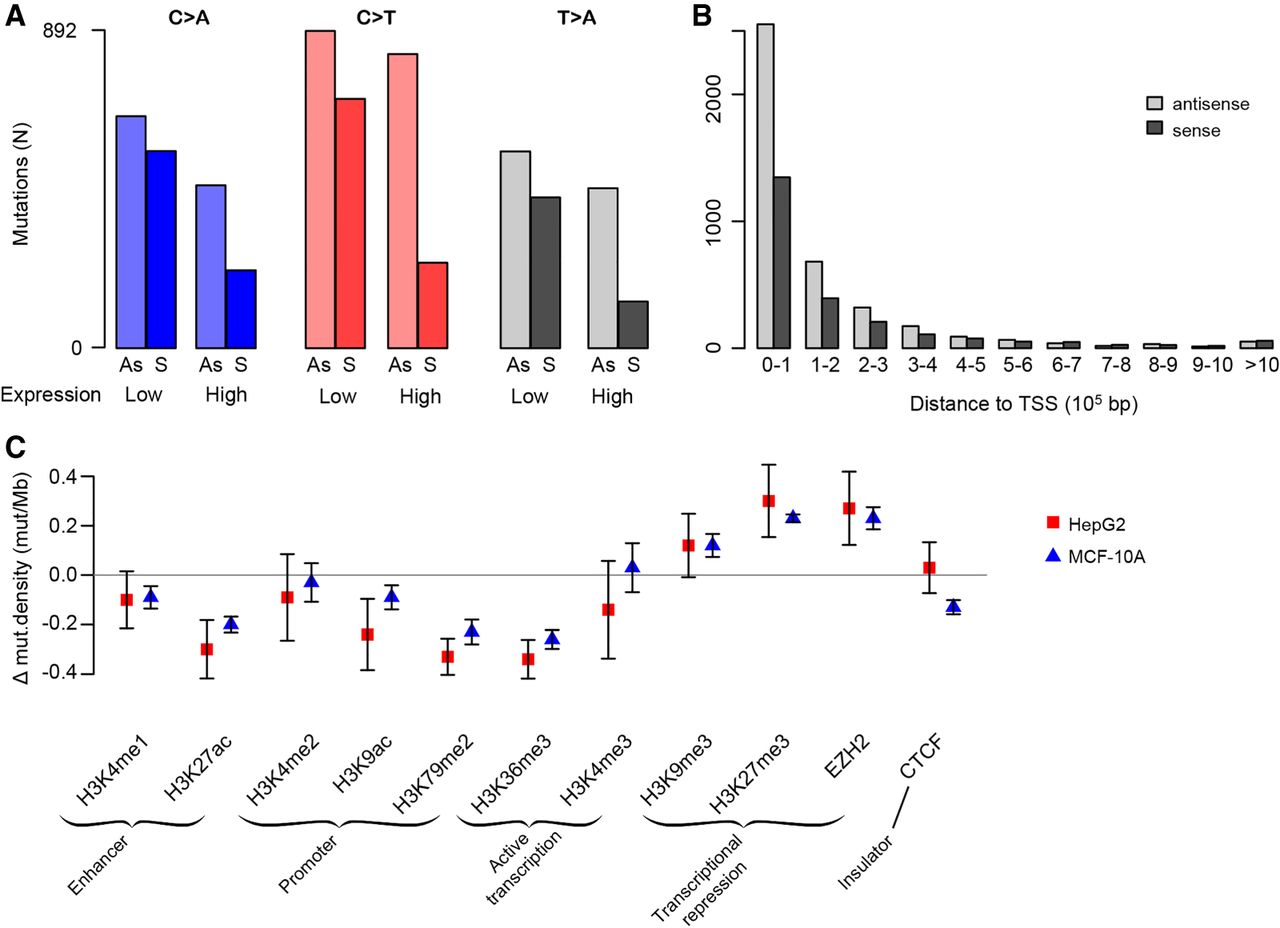
Associations between cisplatin mutagenesis intensity and genomic features. (A) Transcription strand bias is more prominent in highly expressed genes for C > A, C > T, and T > A mutations. See also Supplemental Figure S6. (B) Transcription strand bias decreases with increasing distance from the transcription start site (TSS). See also Supplemental Figure S7. Mutations were binned per 100,000 bp, i.e., the first bars are the numbers of mutations within the first 100,000 bp from the TSS, the next bars are the numbers of mutations in the region from 100,001 to 200,000 bp from the TSS, and so on. (C) Mutation density in regions with histone modifications and in binding sites for EZH2 and CTCF. The y-axis is the mean mutation density for the given region relative to the mutation density of each respective sample; bars show standard error of the mean (Supplemental Table S1).


