
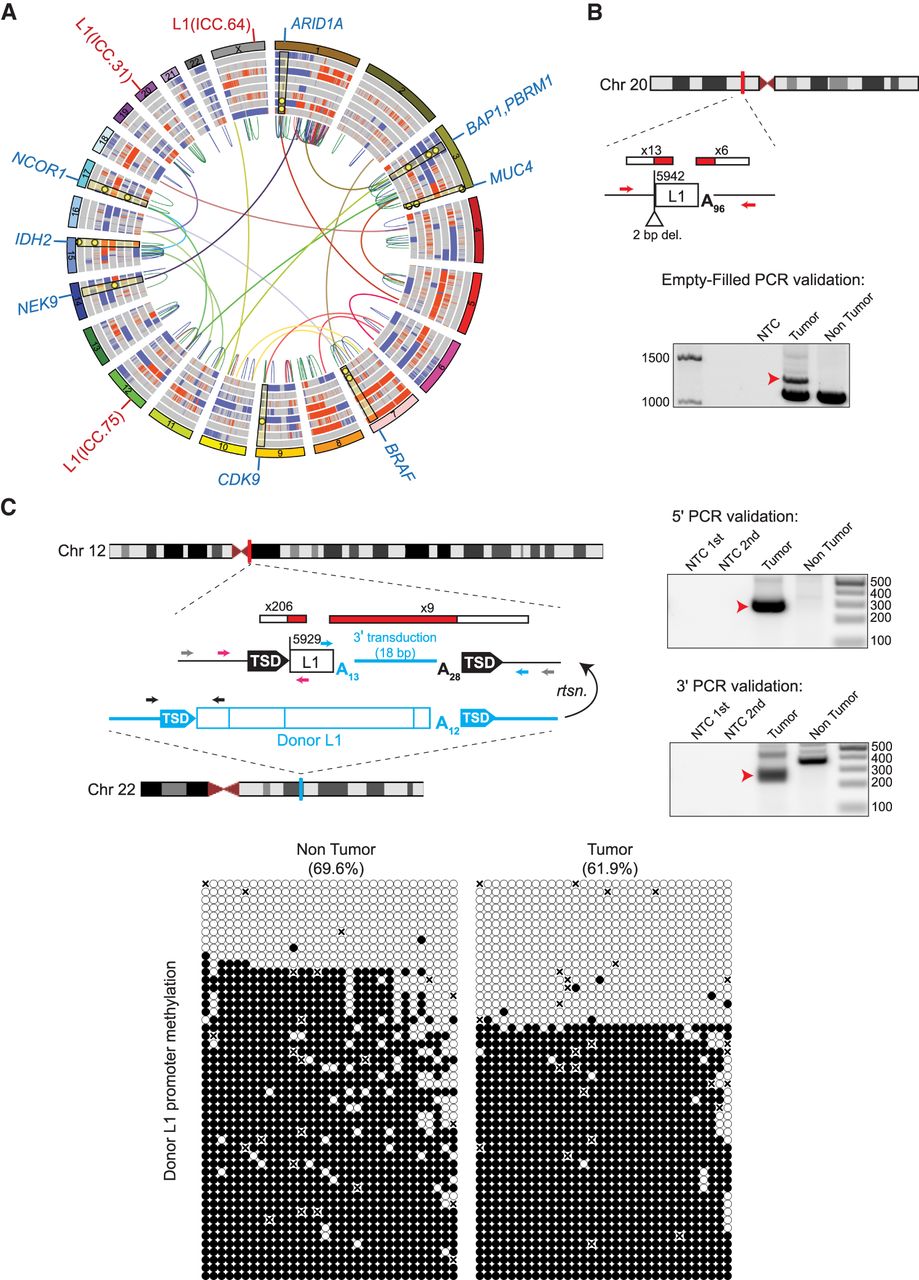
ICC patient tumor mutational landscape, including tumor-specific L1 insertions. (A) Circos diagram (Krzywinski et al. 2009) summarizing ICC somatic mutations including copy number gains (red) and losses (blue), intra-chromosomal (colored by chromosome pair) and inter-chromosomal (red = duplication, blue = deletion, green = inversion) rearrangements. Rearrangements shown are those that intersect genes identified in prior ICC studies or present in the COSMIC Cancer Gene Census. L1 insertions are highlighted in red text labels on the outside of the circle, and selected genes with somatic mutations are highlighted with blue labels. Selected somatic mutations (SNVs and INDELs) are shown as yellow dots with highlights superimposed on the copy number variation rings. (B,C) Detailed characterization of two intergenic and 5′ truncated tumor-specific L1 insertions. For each insertion, the chromosomal location is shown. L1 insertions are depicted as white rectangles; the truncation point of each insertion is indicated. The location and count of junction-spanning RC-seq and WGS reads supporting each insertion are depicted as red and white rectangles. Target-site duplications are shown as black arrows; deletions of genomic DNA are shown as white triangles. Poly(A) tail length is indicated. The positions of PCR validation primers are shown as small arrows. Where empty-filled validation was successful, primers are indicated in red. Where junction PCRs were employed, primers are depicted in pink (5′ junction) and blue (3′ junction). Where hemi-nested PCR was necessary, the outer primer(s) are depicted in gray and the inner primers are depicted in color. Agarose gels containing the empty/filled or 5′ and 3′ junction validation products are shown. Templates are indicated above; for hemi-nested PCR reactions, NTC 1st and NTC 2nd depict the no-template control reactions for the first and second rounds of PCR. Red arrows indicate the validating band. The L1 insertion shown in C carried an 18-bp 3′ transduced sequence implicating a donor L1 (shown in blue) located in the TTC28 gene on Chromosome 22. The methylation state of this specific donor L1 (below) was determined via targeted bisulfite sequencing of its promoter CpG island (primers are depicted in C as black arrows). Each cartoon represents 50 random, nonidentical sequences matching the donor L1 (black circle, methylated CpG; white circle, unmethylated CpG; “x,” absent) obtained from patient ICC.75 nontumor liver and matched tumor.


