
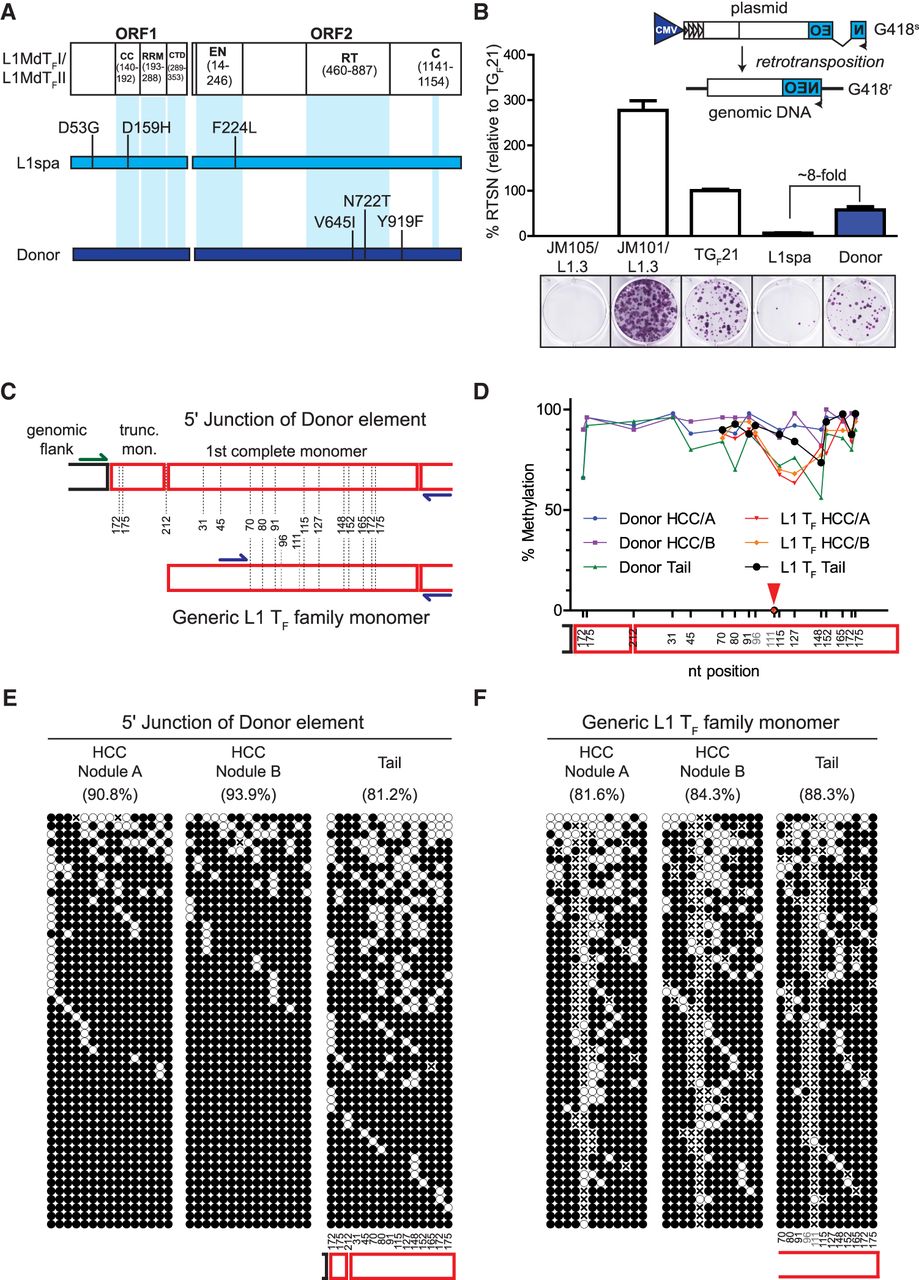
Retrotransposition competence and epigenetic characterization of an active donor L1. (A) Amino acid sequence comparison between the L1MdTF_I/L1MdTF_II consensus sequence (Sookdeo et al. 2013), the L1 TF element L1spa (Naas et al. 1998), and the donor L1 responsible for the tumor-specific 682-bp transduction-bearing L1 TF insertion (Fig. 1B). The locations of functional domains within ORF1p and ORF2p are depicted along the L1MdTF_I/L1MdTF_II consensus. Amino acid changes within L1spa and the donor L1 relative to the L1MdTF_I/L1MdTF_II consensus are shown. (B) (Top) Rationale of the cultured-cell retrotransposition assay (Moran et al. 1996; Wei et al. 2000). An L1 is tagged in its 3′ UTR with a reporter cassette (in this case, a neomycin phosphotransferase gene) in antisense orientation relative to the L1, which is interrupted by an intron with splice donor and splice acceptor sites in sense orientation relative to the L1. This arrangement ensures that, upon transfection of the construct into cultured cells, G418-resistant foci arise only from cells which have undergone a successful round of retrotransposition. (Bottom) Results of the cultured cell retrotransposition assay. Representative wells for each construct are depicted. JM105/L1.3 is a reverse transcriptase-deficient human L1, JM101/L1.3 is a wild-type human L1, TGF21 is a previously-identified active mouse GF subfamily L1, L1spa is a previously identified disease-causing mouse TF subfamily L1, and Donor is the active L1 TF subfamily element identified in this study. The histogram depicts retrotransposition efficiency relative to TGF21. Data represent the mean of three technical replicates ± SD. This assay was repeated three times (biological replicates) with similar results, and a representative assay is shown. (C) Experimental design for analyzing the methylation status of both the donor L1 and the overall population of L1 TF members. The red boxes represent monomers and the dotted lines represent the different CpG dinucleotides. CpG 96 and 111 are variable in the L1 TF population and are not present in the donor L1. Blue primers are specific for the L1 TF family, while the green primer is specific to the junction of the donor L1. (D) Methylation level of the CpG dinucleotides along the L1 sequence. Note that position 111 was present in <10% of the sequences and was completely unmethylated, and has not been taken into consideration for the line drawing (red arrow). (E) The methylation pattern of 50 random products of locus-specific bisulfite sequencing reactions of the donor L1 5′ junction. (F) The overall L1 TF element population is depicted as in E. In E and F, methylated and unmethylated CpGs are represented by solid and empty circles, respectively, while an “x” means a CpG was not present. CpG dinucleotide positions are indicated below the panels for “Tail” but can be extrapolated to the “HCC” panels. The overall percentage of methylated CpG dinucleotides is indicated above each cartoon.


