
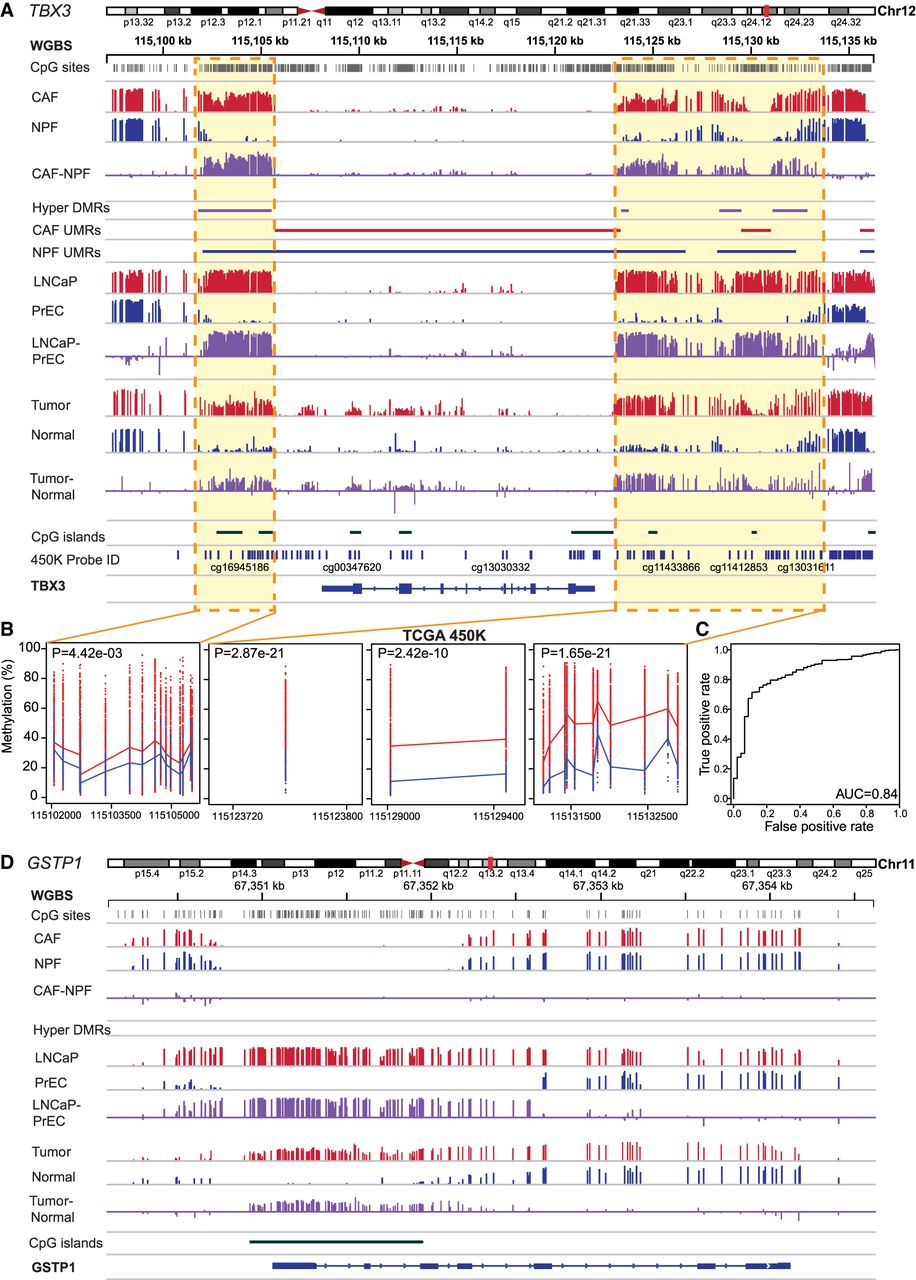
Diagnostic value of tumor-specific DMRs. (A) WGBS data for TBX3 in fibroblasts (CAFs vs. NPFs, n = 4 pairs), epithelial cells (LNCaP vs. PrEC), and patient tissue (matched tumor vs. normal) showing consistent hypermethylated tsDMRs in each data set. (B) 450K data from TCGA is also shown with dots indicating the DNA methylation status of tumor (red, n = 392) and normal (blue, n = 45) samples at each probe (trendlines denote mean methylation). (C) An ROC curve showing that the average methylation status of the four TBX3 tsDMRs discriminates between normal and cancer tissues in TCGA. (D) WGBS data showing lack of hypermethylation of the GSTP1 promoter CpG island in CAFs versus NPFs, unlike LNCaP versus PrEC and matched tumor versus normal patient tissues.


