
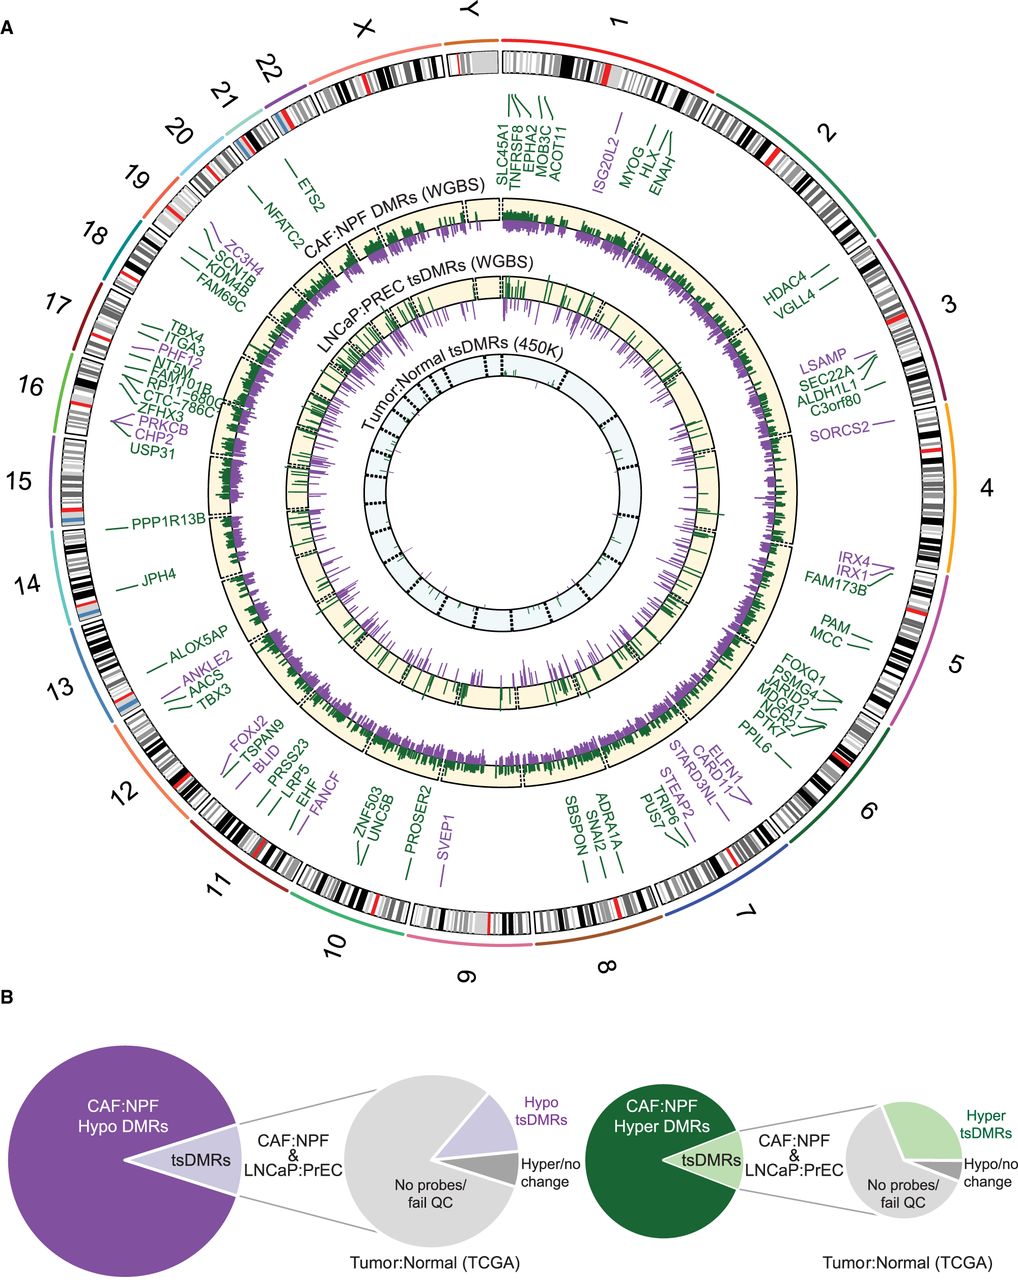
Figure 6.
Tumor-specific DMRs common to CAFs and cancer cells. (A) Circos plot showing common DMRs identified by WGBS of CAF versus NPF, WGBS of LNCaP versus PrEC cells (middle), and 450K arrays of cancer versus normal tissue from TCGA (inner). (Green) Hypermethylated; (purple) hypomethylated. The height of each track represents a 50% methylation difference. Note that only tsDMRs are shown for LNCaP:PrEC and TCGA samples. (B) Pie charts showing the proportion of DMRs that are tsDMRs and that are consistent with 450K data from TCGA.


