
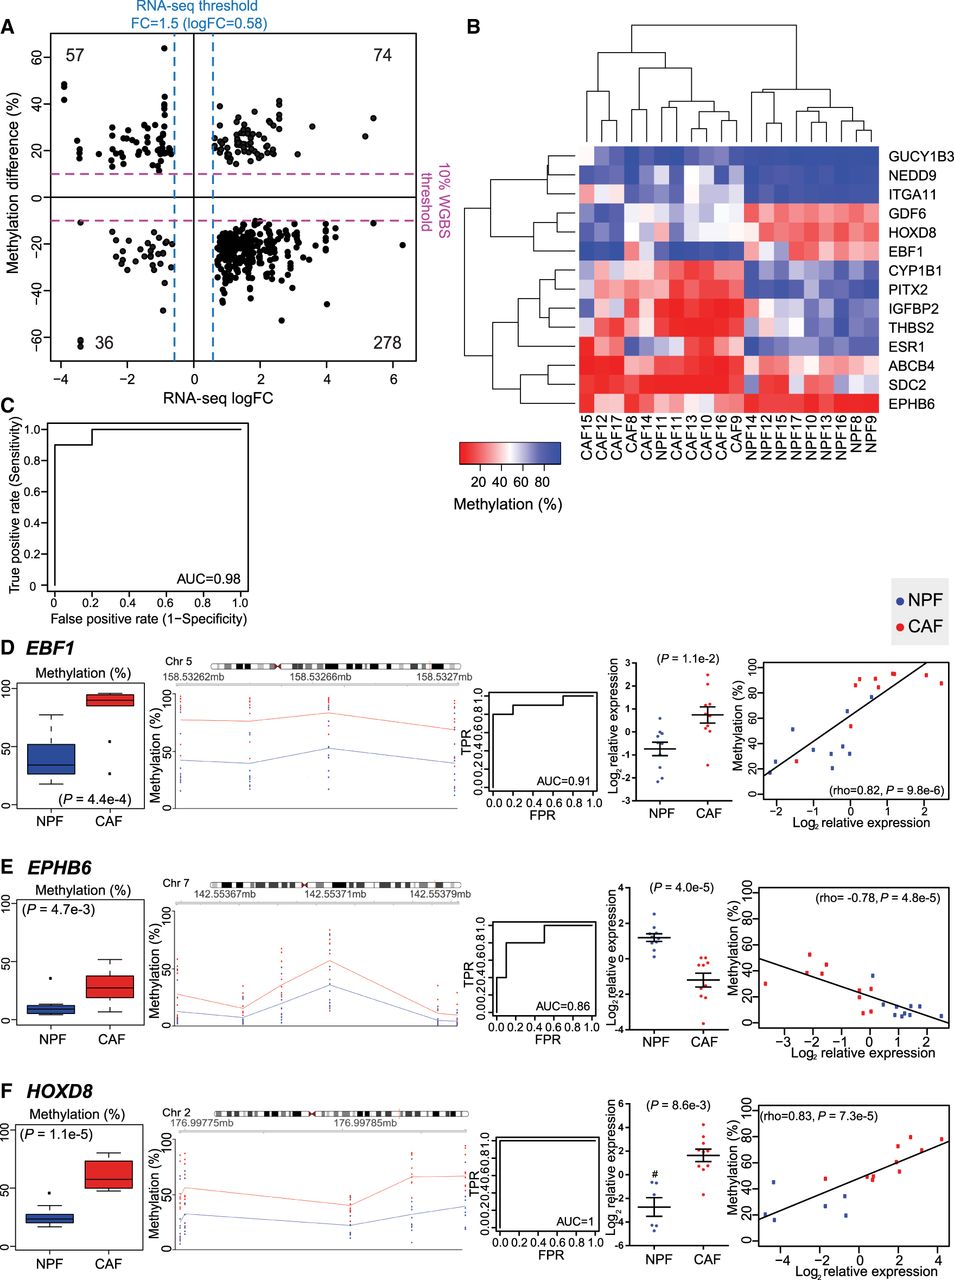
Consistent changes in DMRs associated with differentially expressed genes (DE-DMRs) between patients. (A) Scatter plot of DE-DMRs showing the average percentage difference in DNA methylation versus average log fold change (logFC) in expression (n = 4 CAF-NPF pairs). Dotted lines indicate the thresholds for DE-DMRs. (B) Nonhierarchical clustering of CAFs and NPFs from 10 independent patients based on the methylation status of 14 candidate DE-DMRs. The heatmap shows the percentage of DNA methylation of each DE-DMR in each sample. (C) Receiver operating characteristic (ROC) curve analysis based on the DNA methylation status of the 14 candidate DE-DMRs (AUC = 0.98, n = 10 CAF-NPF pairs). Representative examples of DE-DMRs in the EBF1 (D), EPHB6 (E), and HOXD8 (F) genes ([blue] NPF; [red] CAF), showing the average methylation across the amplicon in CAFs versus NPFs (one-sided paired t-test), the percentage of DNA methylation at each CpG site in each sample (trendlines denote the mean), ROC curves, the relative gene expression in each sample (with mean ± SEM, one-sided t-test), and the significant correlation between methylation and expression (Spearman's test). The # symbol denotes that HOXD8 expression was below the detection limit for NPF10, NPF13, NPF15, and NPF17; therefore, n = 6 for NPFs and n = 10 for CAFs.


