
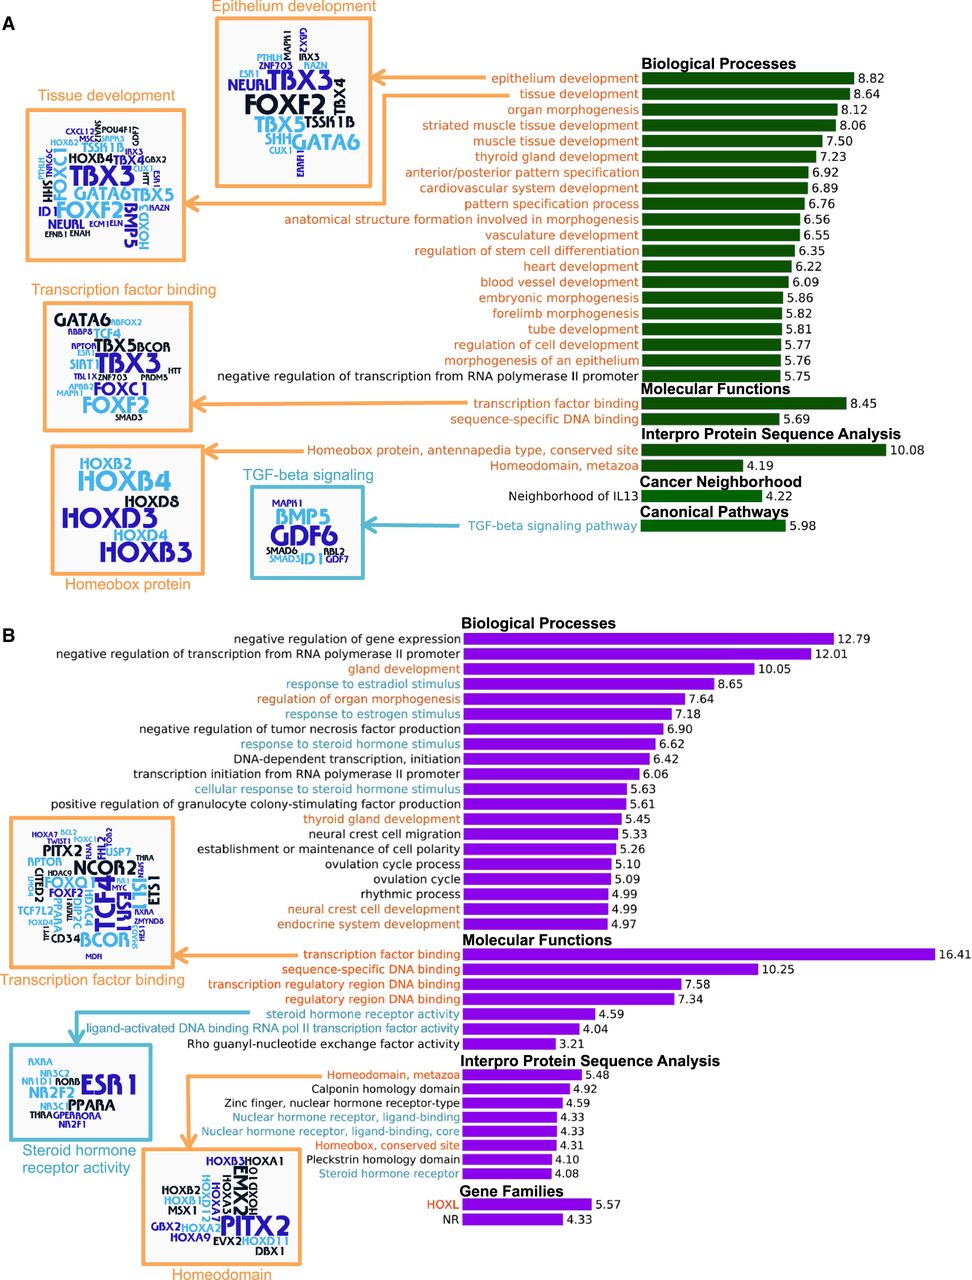
Figure 4.
DMRs are associated with genes in cancer-related pathways. Genomic regions enrichment (GREAT) analysis of hypermethylated (A) and hypomethylated (B) DMRs in CAFs compared to NPFs. Bar charts display −log10 P-values from the binomial test for selected categories. Analysis shows enrichment for developmental processes and transcription factor binding (orange) and ligand-activated cell signaling (blue). Word clouds show the genes comprising each of the categories, with word size proportional to the number of proximal DMRs.


