
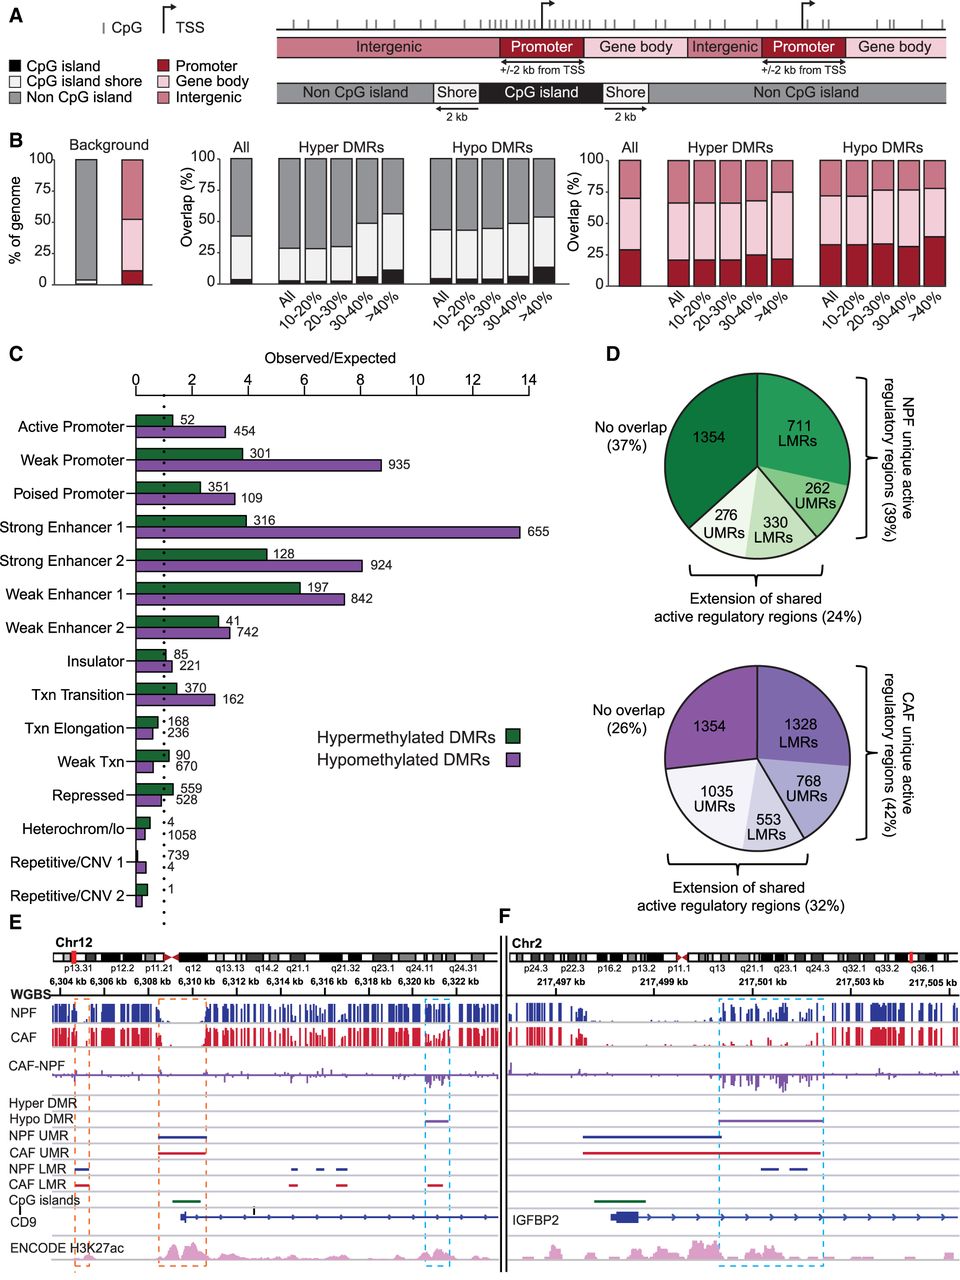
DMRs occur at regulatory regions. (A) Schematic showing the genomic regions investigated in B. (B) The distribution of all CAF–NPF DMRs, and CAF–NPF DMRs grouped by percentage change in methylation, relative to each type of genomic region in A. (C) Comparison of CAF DMRs with ChromHMM data from normal fibroblasts. Numbers denote the number of DMRs associated with each type of region. Note that ENCODE defines two types of strong enhancers, weak enhancers, and repetitive/CNV regions. (D) The proportions of DMRs associated with LMRs and UMRs that are unique to NPFs (for hypermethylated DMRs) or CAFs (for hypomethylated DMRs) or that extend from LMRs and UMRs that are shared by NPFs and CAFs. (E) Pooled WGBS data (n = 4 patients) showing a hypomethylated DMR in the CD9 gene (blue box) occurring at a regulatory region defined by ChromHMM H3K27ac peaks (pink track) and a unique CAF LMR. Shared UMRs and LMRs between CAFs and NPFs are also shown (orange boxes). (F) A hypomethylated DMR in IGFBP2 (blue box) arising from a shared UMR that extends in CAFs. The DMR lies in a regulatory region defined by ChromHMM H3K27ac peaks.


