
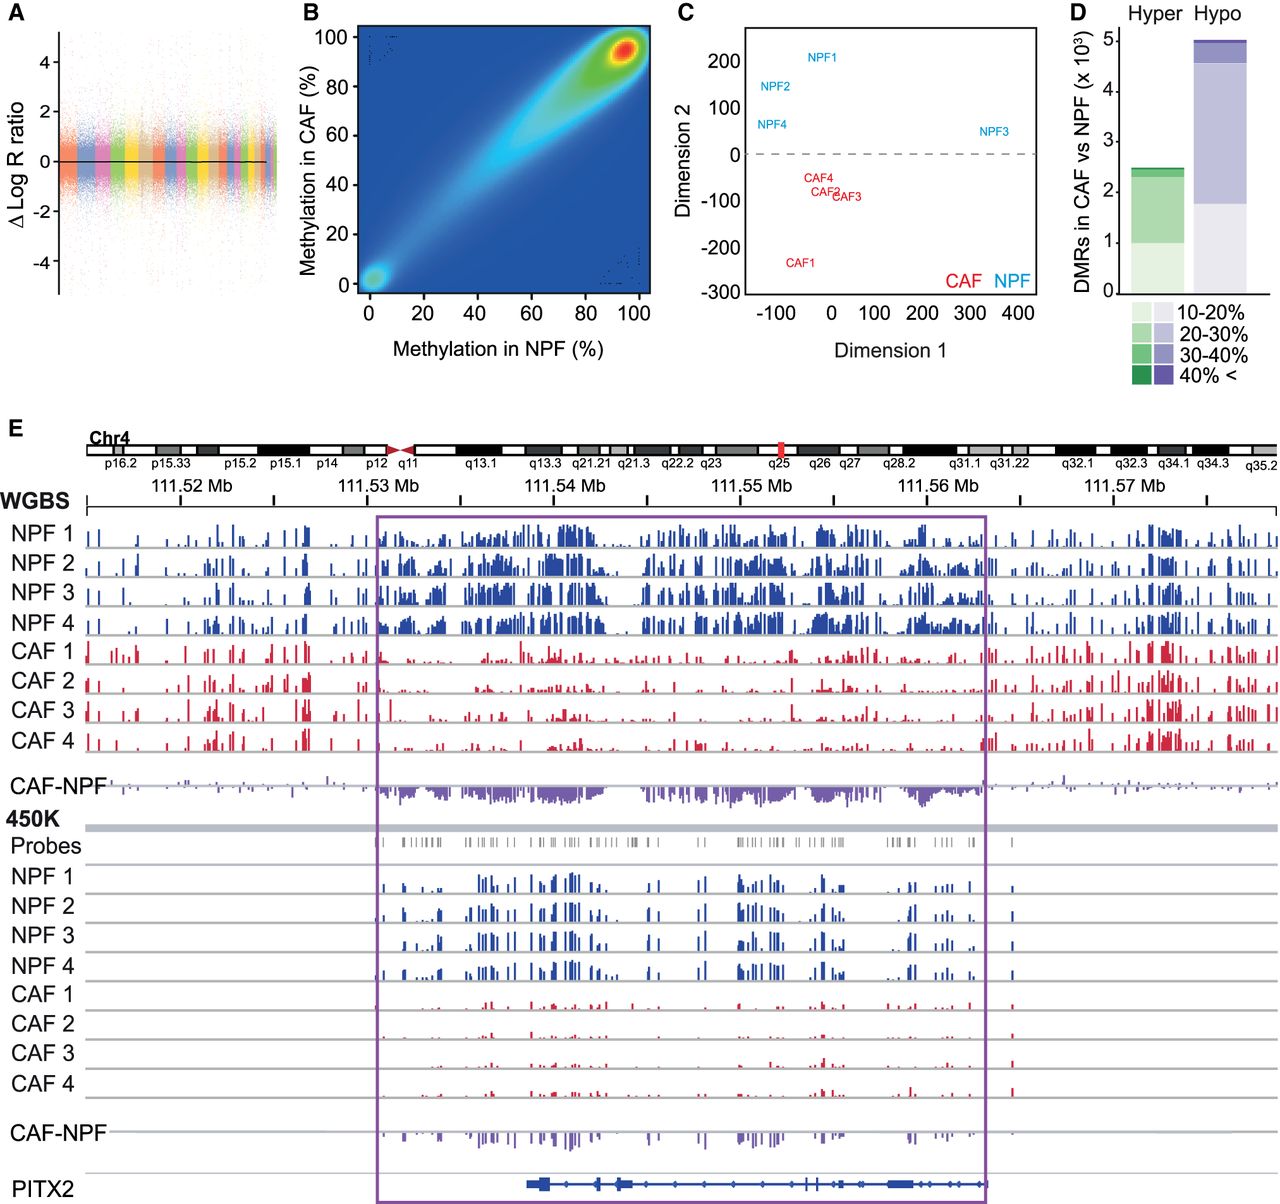
CAFs and NPFs have similar global methylation profiles but discrete methylomic differences. (A) Representative SNP array data (patient 1) showing no large-scale genomic aberrations. (B) High correlation (r = 0.90, P < 2.2 × 10⁻¹⁶) of WGBS DNA methylation levels between CAFs and NPFs (n = 4 pairs) indicates no global perturbations between cell types. (C) MDS plot of the 10% most variably methylated regions shows clear separation of CAFs and NPFs. (D) The number of hypermethylated (green) and hypomethylated (purple) DMRs in CAFs according to the percentage change in DNA methylation. (E) WBGS and 450K data for PITX2 for each NPF (blue) and CAF (red). The average difference in DNA methylation in CAFs compared to NPFs is shown in purple. The height of each vertical line represents the percentage of DNA methylation at each CpG site. The locations of 450K probes are shown in gray. The purple box highlights a large region of hypomethylation measured on both platforms.


