
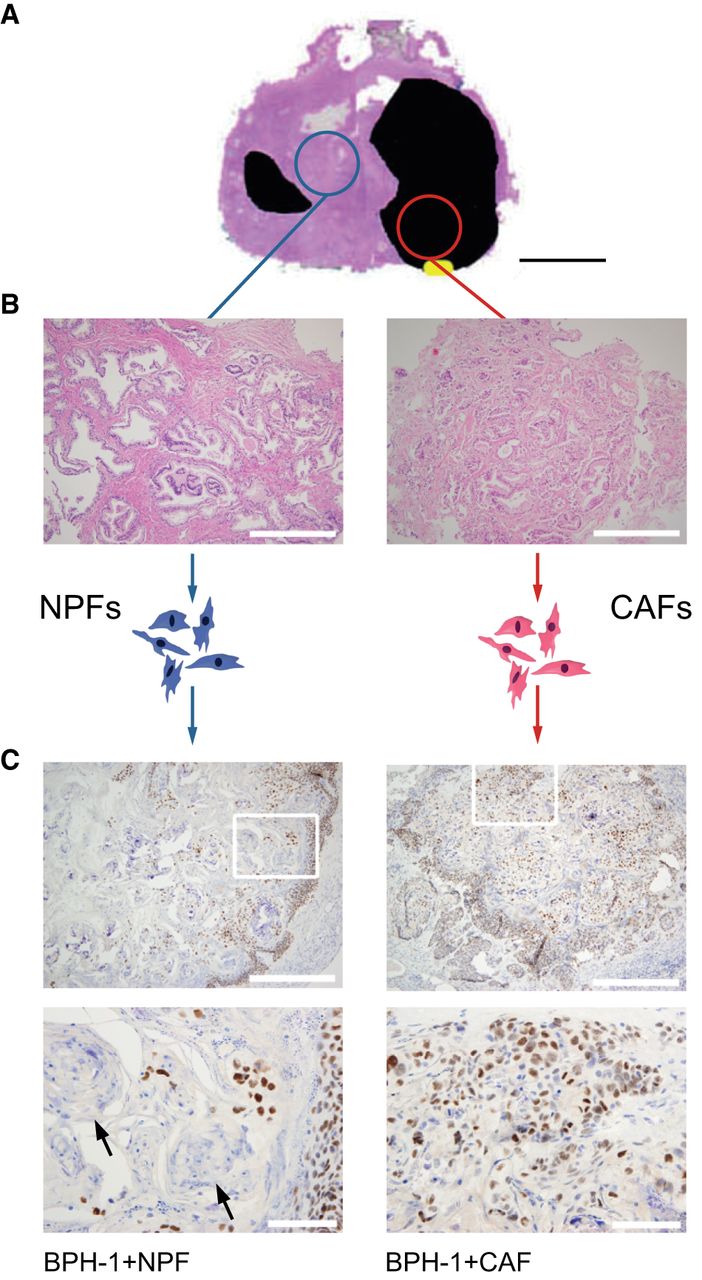
Isolation and validation of matched CAFs and NPFs from patient tissue. Representative data from patient 1. (A) Matched nonmalignant (blue) and cancer (red) tissue were dissected from the same radical prostatectomy specimen and used to establish primary cultures of CAFs and NPFs. (Scale) 2 cm. (B) Hematoxylin and eosin staining confirmed that NPFs were from a nonmalignant region and that CAFs were from a region of Gleason 3+4 cancer. (Scales) 500 µm. (C) Grafts from tissue recombination assays with BPH-1 epithelial cells stained for SV40 T antigen (brown) and nuclei counterstained with hematoxylin (blue). BPH-1 cells combined with NPFs formed well-differentiated structures, evident from organized layers of epithelial cells with abundant keratinization (arrows). In contrast, BPH-1 cells combined with CAFs formed poorly differentiated structures, consistent with tumorigenesis, apparent from the disorganized clusters of epithelial cells and limited keratinization. White boxes indicate the areas shown in higher magnification. (Scales) 500 µm for low magnification images and 100 µm for high magnification images.


