
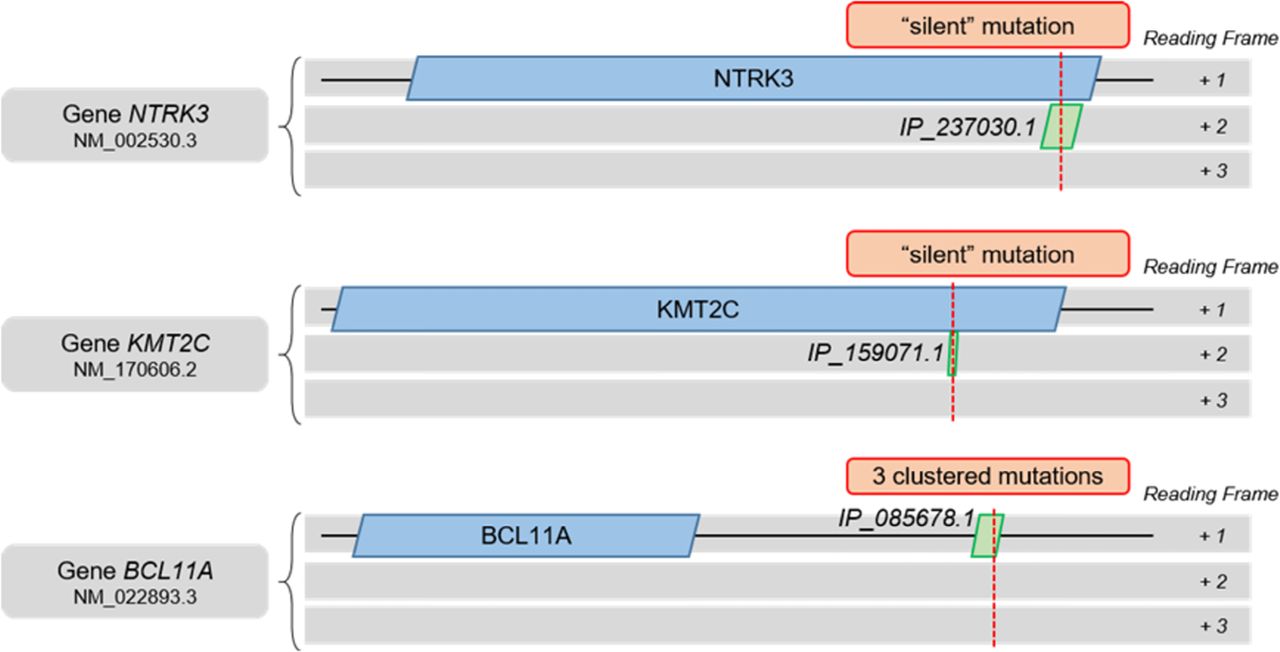
Figure 6.
Graphical representation of alternative ORFs affected by “silent” and clustered 3′ UTR SNVs in NTRK3, KMT2C, and BCL11A genes. Length proportions between the full mRNA, the canonical CDS, and the alternative ORF are respected. The SNV position is represented by a red dotted line. The RefSeq transcript accession number (NM_) and the alternative ORF OpenProt accession number (IP_) are indicated.


