
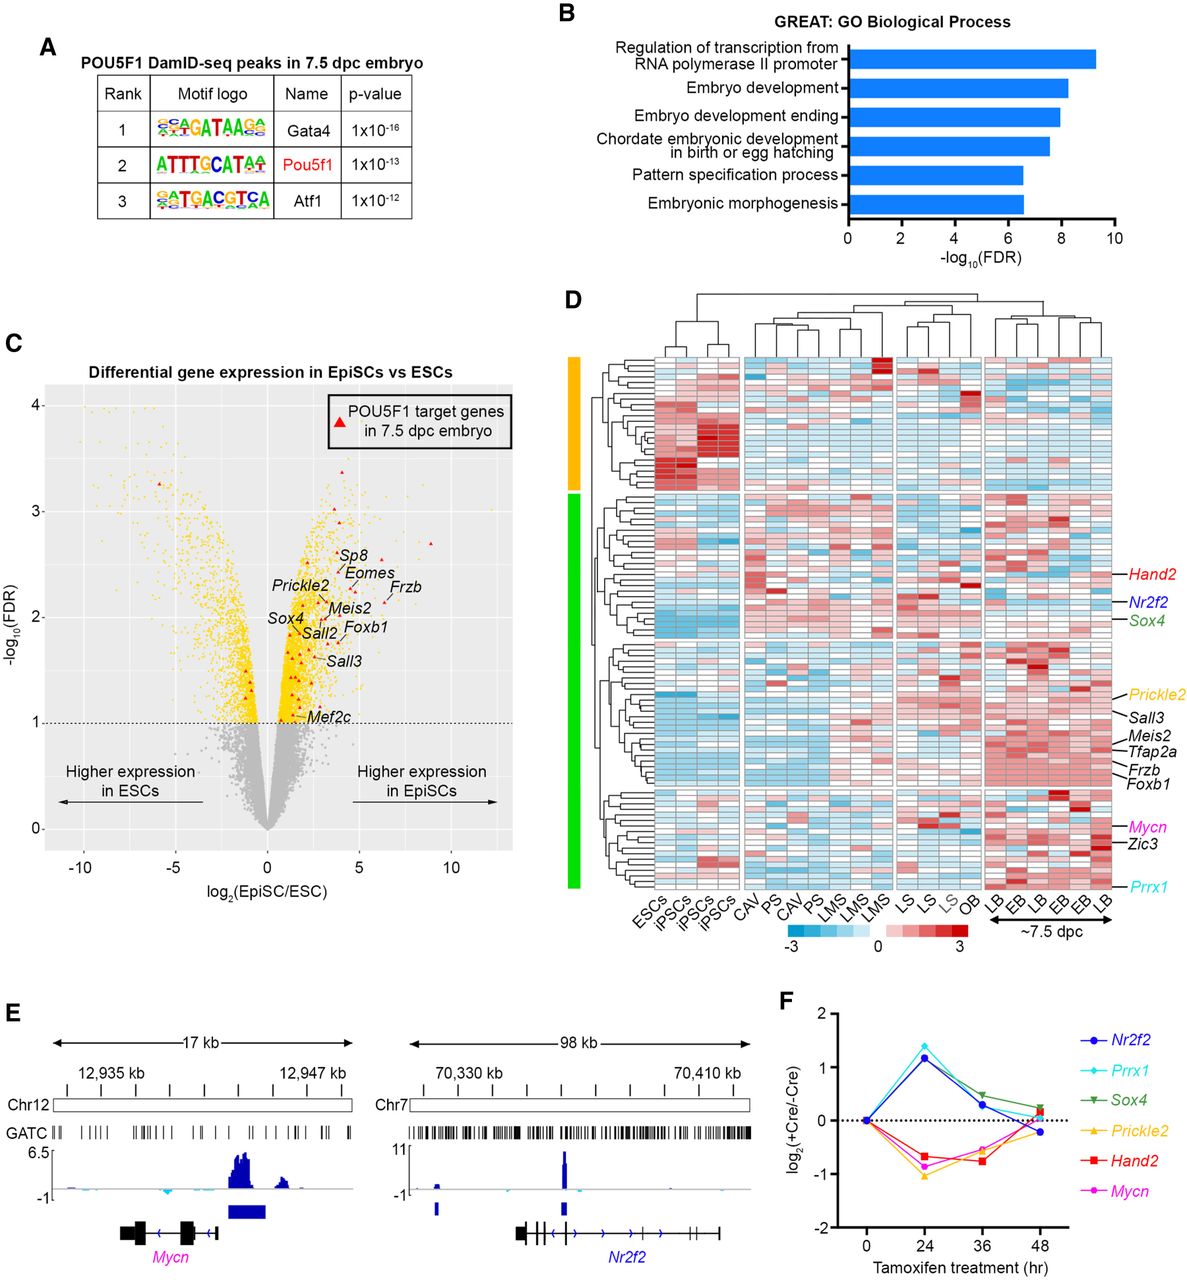
Analysis of POU5F1 target genes in the 7.5-dpc epiblasts. (A) Motif enrichment analysis (Heinz et al. 2010) of the epiblast POU5F1 DamID-seq peaks. (B) GO enrichment analysis of POU5F1 DamID-seq peaks from 7.5-dpc epiblasts using GREAT (McLean et al. 2010). (C) Differentially expressed genes between ESCs and EpiSCs (Tesar et al. 2007). Red triangles represent the POU5F1 binding peak–associated genes in 7.5-dpc epiblasts. (D) Expression levels of the 7.5-dpc epiblast POU5F1 binding peak–associated genes in ESCs and post-implantation epiblasts (Kojima et al. 2014). Genes whose expression significantly changed 24 h after Pou5f1 deletion in the 7.5-dpc mouse embryo (DeVeale et al. 2013) are indicated in color. (CAV) Epiblast of cavity; (PS) prestreak; (LMS) late mid streak; (LS) late streak; (OB) no bud; (EB) early bud; (LB) late-bud. (E,F) POU5F1 binding peaks identified by DamID-seq (E) and expression changes of the development-related six genes upon Pou5f1 deletion in 7.5-dpc embryos (F) (DeVeale et al. 2013).


