
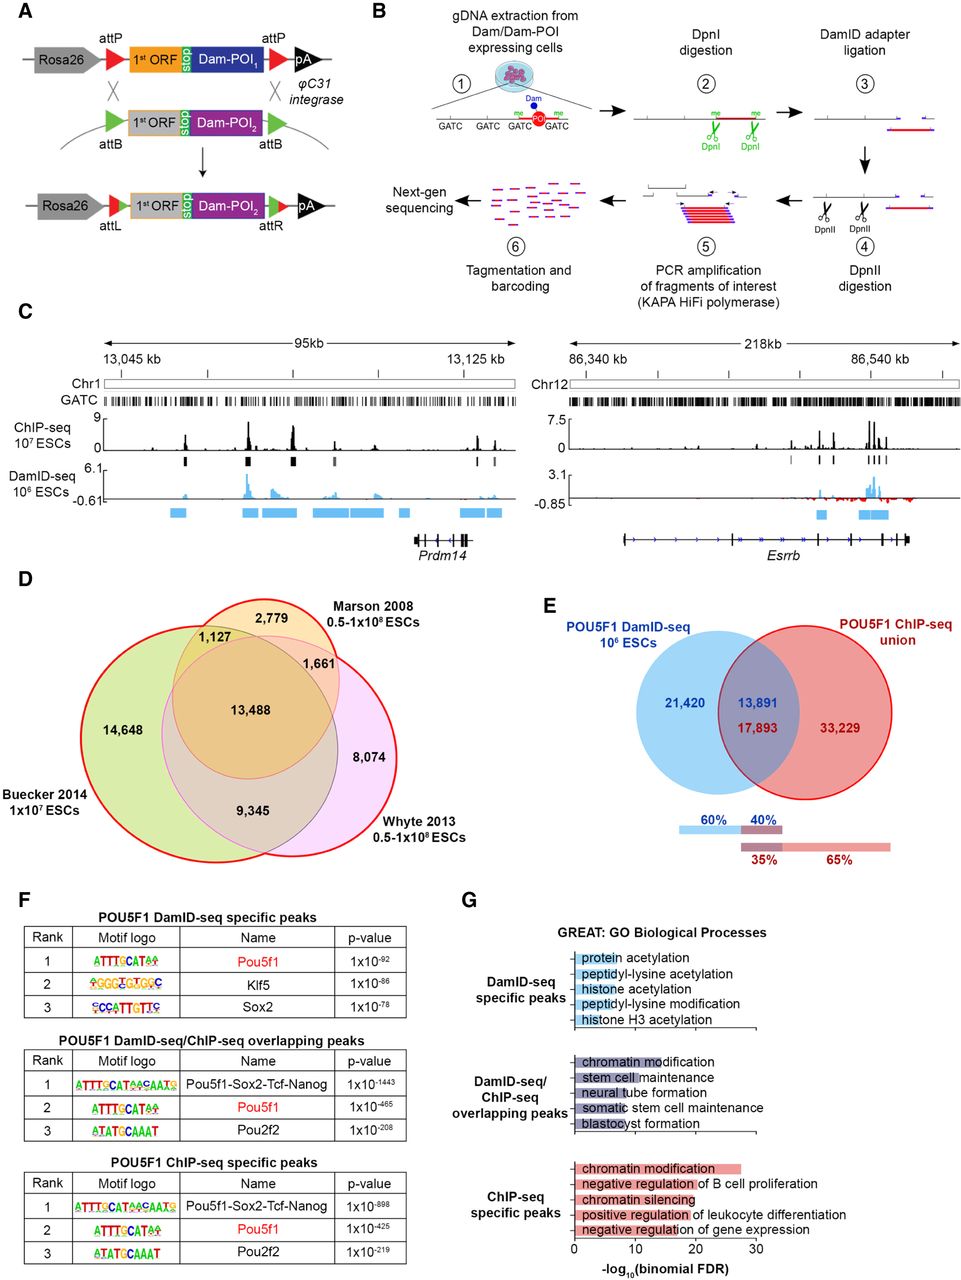
Optimization of DamID-seq in mouse embryonic stem cells (ESCs) and comparison with ChIP-seq. (A) φC31 integrase–mediated cassette exchange system used to generate the cell lines in this study. (POI) Protein of interest; (ORF) open reading frame. (B) The optimized DamID-seq workflow. (C) POU5F1 DamID-seq tracks generated from 106 ESCs and POU5F1 ChIP-seq tracks generated from 107 ESCs (Buecker et al. 2014). The bars below each track represent ChIP-seq (black) and DamID-seq (blue) statistically significant peaks; y-axis represents read counts per million of Dam-POU5F1 (Dam-subtracted) and POU5F1 ChIP-seq (input-subtracted), respectively. (D) Peak overlap between three different published POU5F1 ChIP-seq data sets (Marson et al. 2008; Whyte et al. 2013; Buecker et al. 2014). (E) Overlap between POU5F1 DamID-seq peaks and the union of ChIP-seq peaks. Since DamID-seq peaks are larger than ChIP-seq peaks (see Supplemental Fig. S6B) and can contain multiple ChIP-seq peaks within, the number of the overlapping peaks are shown separately for each technology. (F) Motif enrichment analysis (Heinz et al. 2010) of the POU5F1-bound peaks identified only by DamID-seq, ChIP-seq, or both technologies. (G) Gene ontology (GO) enrichment analysis of POU5F1 peaks identified only by DamID-seq, ChIP-seq, or both using GREAT (McLean et al. 2010).


