
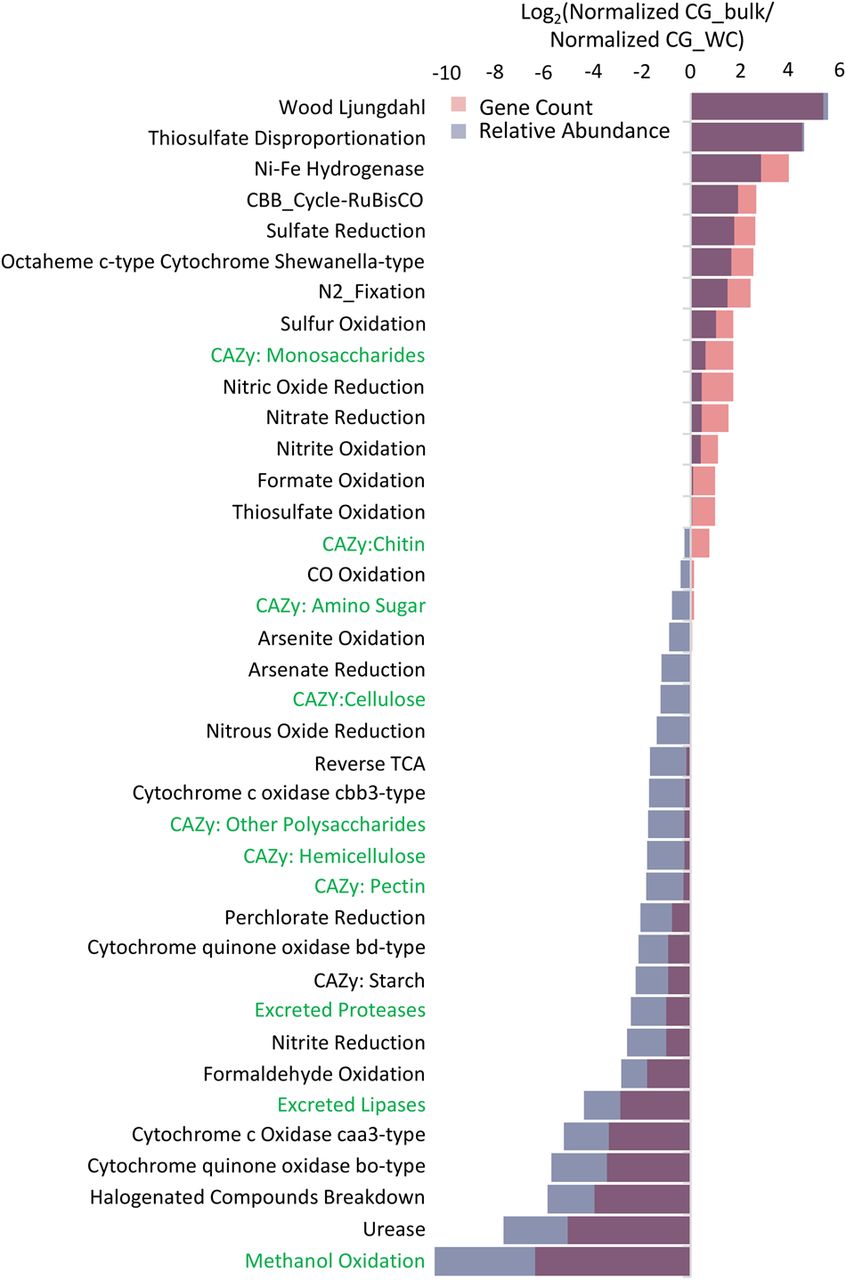
Comparison of CG_WC and CG_bulk metabolic capacity. Log2 ratio of all annotated genes found within the CG_bulk sample against annotated genes found in the CG_WC sample. Annotated genes were grouped into categories based upon scores with a custom set of metabolic pathway marker HMMs (Anantharaman et al. 2016), CAZyme HMMs (Cantarel et al. 2009), and protease and lipase HMMs from MEROPs and the Lipase Engineering Database, respectively. Putative proteases and lipases were also filtered to only those containing a secretion signal and less than three transmembrane domains (see Methods). Gene count (red) is the ratio of total number of genes in each category for each sample normalized by the total number of genes found in the sample. Relative abundance (blue) is the ratio of average read coverage depth of the contig containing a given annotated gene in each category normalized by the sample read count multiplied by read length.


