
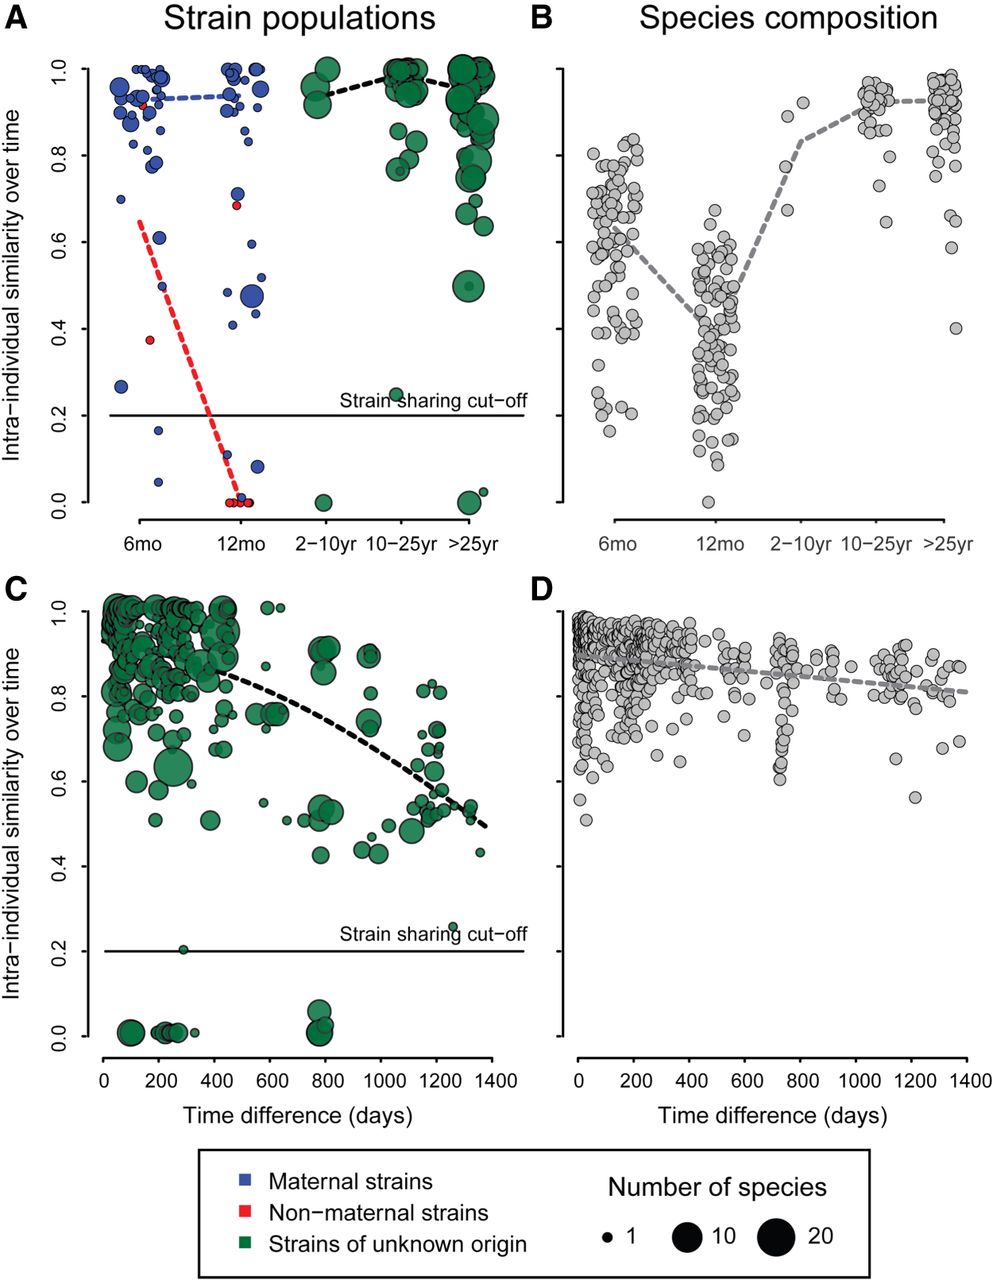
Figure 2.
Intra-individual similarity over time. Panels A and B show similarity to previous time points at different ages (median over all time points per individual, including vaginally born infants and children, and adults irrespective of birth mode; N = 282). Panels C and D show intra-individual similarity by time difference between samples in >1-yr-olds (N = 304).


