
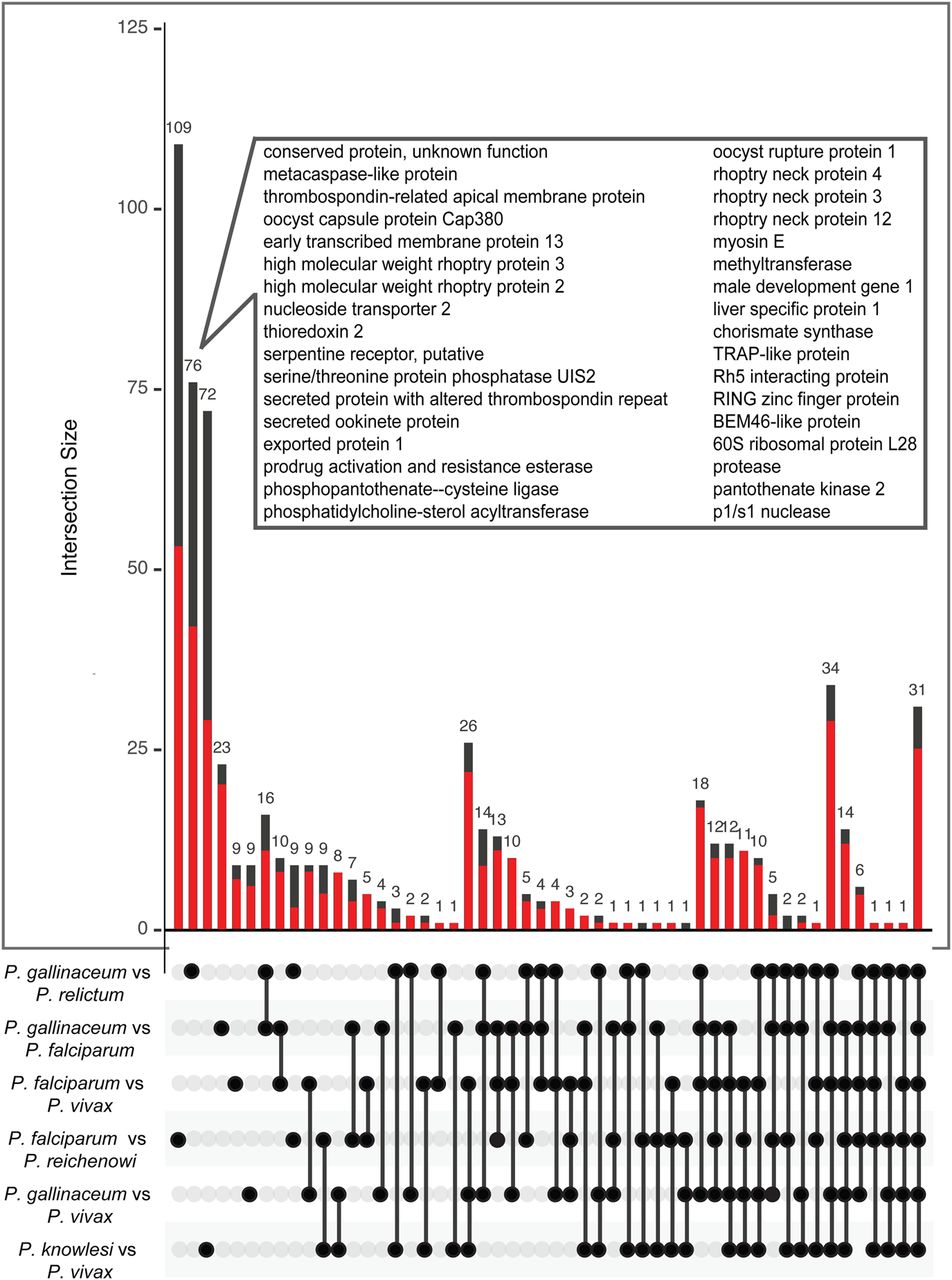
Figure 7.
Analysis of genes with high rates of nonsynonymous substitutions (dN) between six species. From pairwise comparisons within- and between-clades, the 250 highest scoring genes were selected. The matrix shows the intersections between the six gene lists, and the bar plot above shows the number of genes that are unique to each intersection. The fraction of genes with unknown function in each category is shown with a red bar. The gene products are shown for the avian species comparison, which had the most significant Gene Ontology (GO) term enrichment.


