
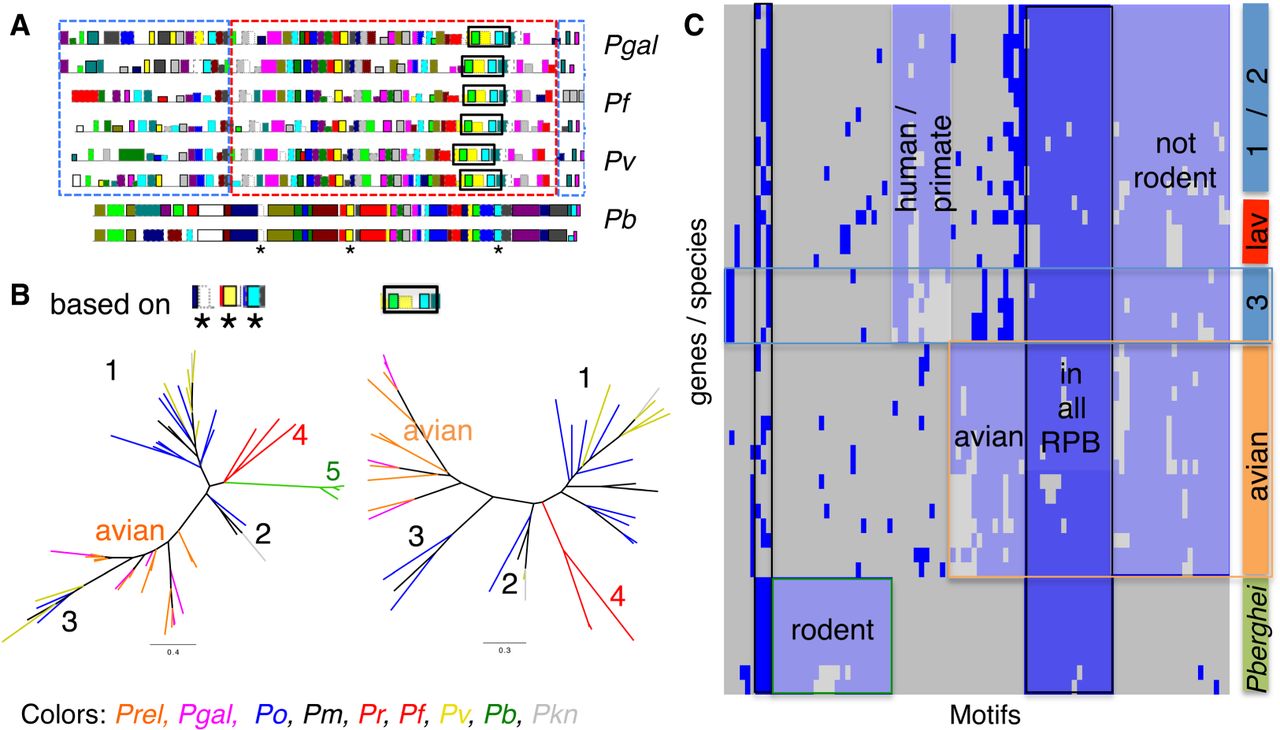
RBP MEME motifs comparison. Analysis of 96 MEME motifs obtained from reticulocyte binding proteins (RBPs) of nine species. (A) Example of motifs predicted on two RBPs from each of four species. Each colored rectangle (along the protein) represents a different one of the 96 motifs, with their heights corresponding to their respective E-values. The red dashed box around the sequences of P. gallinaceum, P. falciparum, and P. vivax highlights a similar order of motifs. The blue dashed boxes on either side highlight differences in motif content. The black box and the three stars are motifs used to build the tree in B. (B) Two maximum-likelihood phylogenetic trees based on two motif sets. The left tree was generated using the three motifs (indicated with an asterisk * in panel A, in total 72 aa long), and the second tree was generated using the motifs from the black box in panel A, 169 aa long (all bootstrap values are 100). Labels 1, 2, and 3 identify the distinct clusters of the P. malariae, P. ovale, and P. vivax RBPs, as previously reported (Rutledge et al. 2017), four P. falciparum and P. reichenowi and five P. berghei. (C) Clustering of the binary occurrence of MEME motifs for each RBP, similar to Figure 5B. The bar on the right represents either species (lav [Laverania], avian, P.berghei) or the groups 1,2, and 3 from B. This analysis does not split group 1 and 2 of P. malariae, P. ovale, and P. vivax RBPs. The x-axis represents the 96 motifs. Blue represents at least one occurrence of that motif for that gene. Shared patterns are highlighted with colored boxes.


