
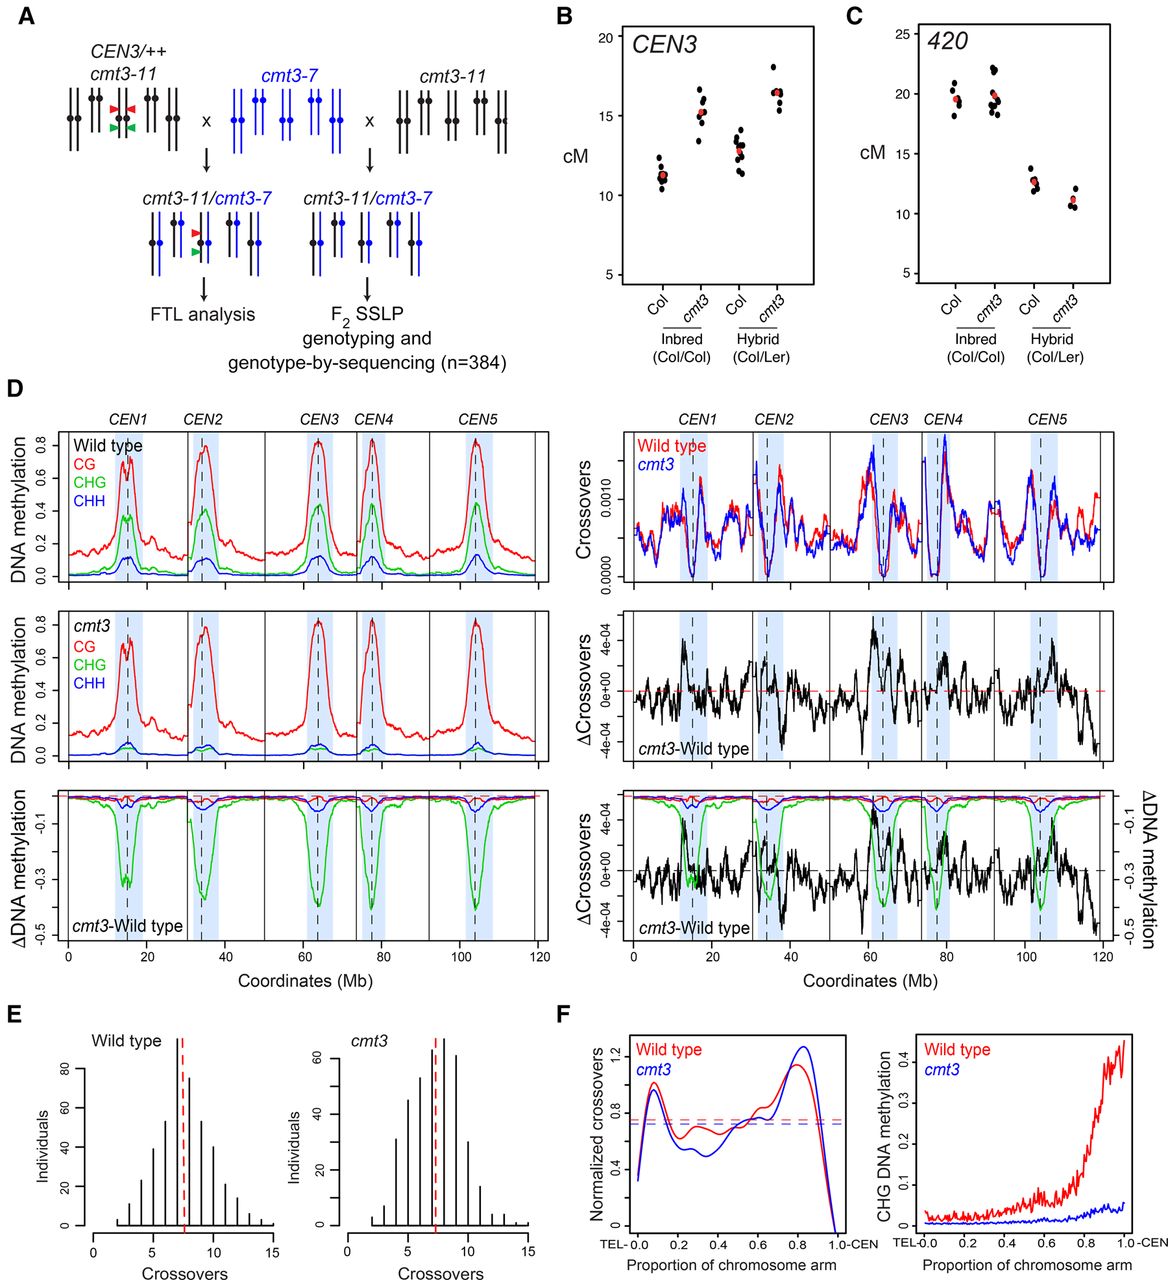
Genome-wide mapping of crossover frequency in cmt3 non-CG mutants. (A) Crossing scheme used to analyze recombination in cmt3 mutants. Col chromosomes are black and Ler chromosomes are blue. The CEN3 FTL T-DNAs are indicated by red and green triangles. (B) CEN3 crossover frequency (cM) in wild type and cmt3, in Col/Col inbreds, or Col/Ler F1 hybrids. Replicate measurements are shown in black and mean values in red. (C) 420 crossover frequency in wild type and cmt3, in Col/Col inbreds, or Col/Ler F1 hybrids, as shown for B. (D) Plots of the A. thaliana chromosomes on a continuous x-axis are shown. Analysis of DNA methylation frequency in CG (red), CHG (green), and CHH (blue) from published data in wild type (Col) or cmt3-11 (Stroud et al. 2013) (left panels). A differential (cmt3 − wild type = ΔDNA methylation) plot is also shown. Vertical dotted lines indicate the position of the centromere assembly gaps and vertical solid lines indicate telomeres. The pericentromeres, defined by higher than average DNA methylation, are indicated by light blue shading. The normalized frequency of crossovers mapped by GBS in wild type (red) and cmt3 (blue) F2 populations is plotted (right panels), in addition to the cmt3 − wild type differential (ΔCrossovers). (E) Histograms of crossovers per F2 individual for wild-type and cmt3 populations. Red dotted lines indicate mean values. (F) Normalized crossover frequency analyzed along chromosome telomere (TEL) to centromere (CEN) axes in wild-type (red) and cmt3 (blue) populations. CHG DNA methylation was analyzed and plotted similarly for wild type (red) or cmt3 (blue) (Stroud et al. 2013).


