
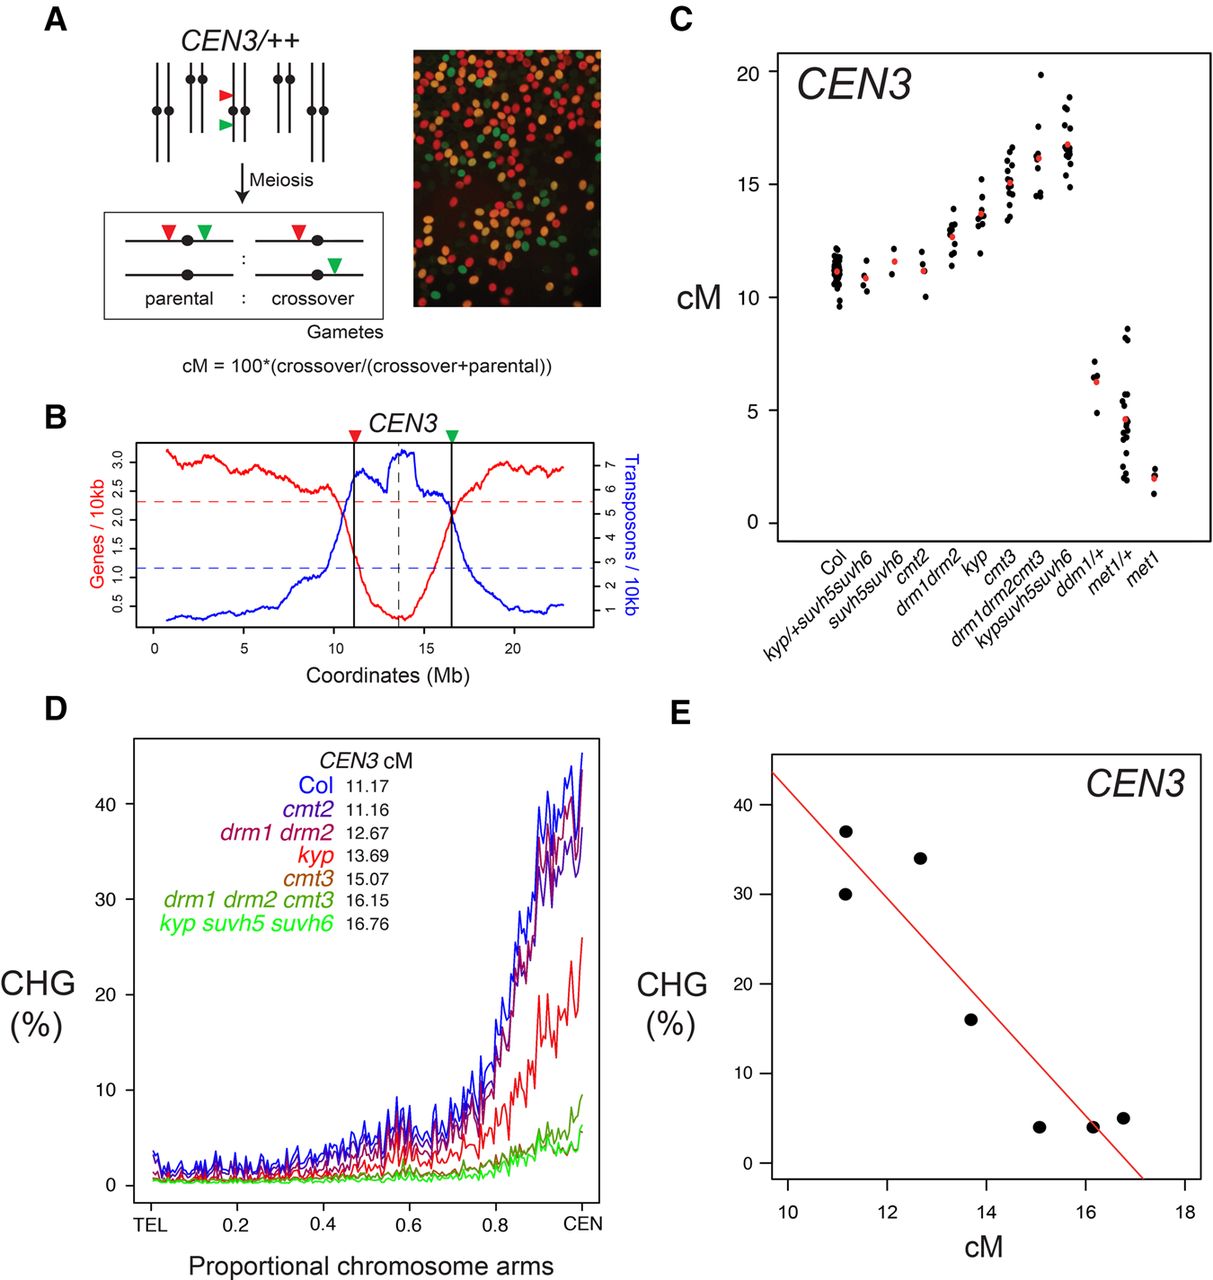
Progressive increases of pericentromeric crossover frequency in H3K9me2 and non-CG DNA methylation pathway mutants. (A) Measurement of crossover frequency using segregation of hemizygous fluorescent tagged line (FTL) T-DNAs. A representative fluorescent micrograph is shown of FTL/+ pollen, reproduced from Choi et al. (2016). (B) A rolling mean of gene (red) and transposon (blue) density (number of start coordinates per adjacent 10-kb window) are plotted along Chromosome 3, with the location of CEN3 FTL T-DNAs indicated by vertical lines. Mean values are indicated by the horizontal dotted lines and the centromere assembly gap by the vertical dotted line. (C) CEN3 crossover frequency (cM) in DNA methylation mutants. Data for met1 and met1/+ are reproduced from Yelina et al. (2015). Black dots represent replicate measurements and red dots show mean values. (D) Published BS-seq data (Stroud et al. 2013) were used to analyze CHG DNA methylation density along chromosome telomere-centromere axes in wild type and H3K9me2/non-CG DNA methylation mutants. Lines are colored according to CEN3 cM (blue = highest, red = intermediate, green = lowest). (E) Correlation between CEN3 cM and CHG DNA methylation from published BS-seq data (Stroud et al. 2013).


