
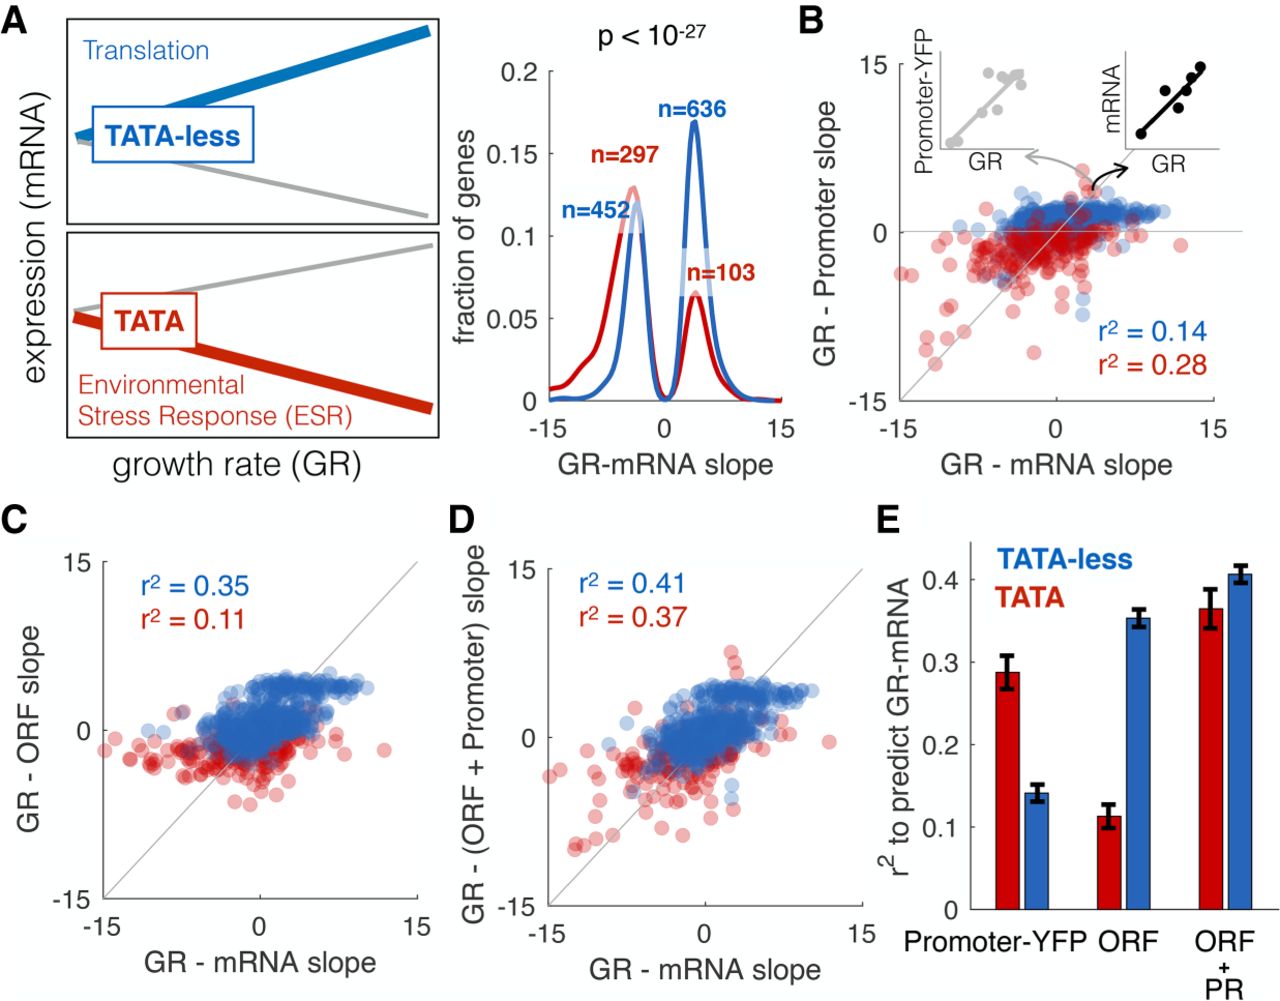
ORF features regulate expression in response to changes in growth rate. (A) Brauer et al. (2008) grew yeast at six different growth rates in each of six different environments and measured how the expression of each gene changed as a function of growth rate (slope GR-mRNA). TATA-less genes (blue; N = 1088) increase in expression, while those with TATA boxes (red; N = 401) more often decrease. The P-value is from a Fisher's exact test. (B) Keren et al. (2013) measured promoter-YFP expression at different growth rates. Each point shows the slope (expression change as a function of growth rate) for promoter-YFP (y-axis) and steady-state mRNA (x-axis) for TATA (red) or TATA-less (blue) genes. (C) GR-mRNA was predicted from ORF features allowing us to calculate the slope between growth rate and the contribution of ORF to expression (GR-ORF). Shown is the relationship between GR-ORF and GR-mRNA (see A), for each type of genes. (D) GR-mRNA was predicted from both GR-promoter and ORF features (GR-(ORF + promoter)). Shown is the relationship between this and GR-mRNA, for each type of genes (E) R2 values for a model that predicts GR-mRNA from GR-promoter, ORF features, or ORF + promoter for each type of genes. Error bars are standard deviation, calculated with bootstrapping.


