
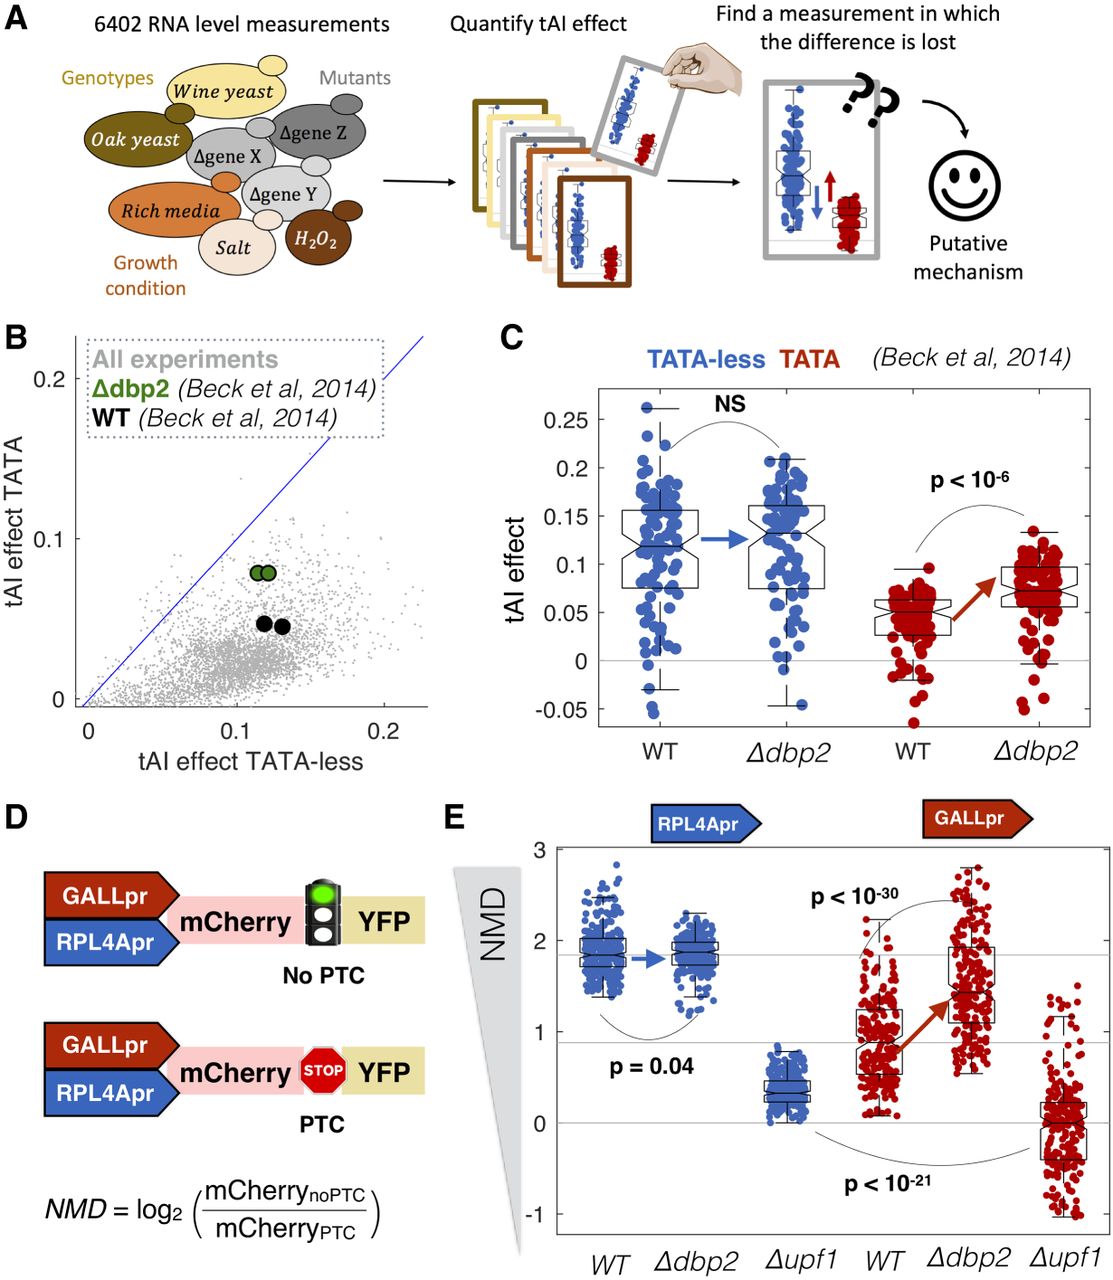
A computational genetic screen for mutants that alter promoter-specific cotranslational regulation. (A) We analyzed expression data for 6402 RNA-seq experiments in S. cerevisiae and, for each experiment, predicted mRNA levels from promoter-YFP data alone or promoter-YFP and codon bias (tAI). (B) For each for the 6402 experiments, we calculated the ability of tAI to improve R2 for TATA-less and TATA-containing genes. Highlighted is a single experiment (Beck et al. 2014) in which the R2 changes in a promoter class–specific manner between wild-type and mutant cells. (C) Shown are the changes in R2 for wild-type and Δdbp2 cells for TATA-containing and TATA-less transcripts. Each point corresponds to the effect of tAI on expression from equal-sized random samples of TATA (red) and TATA-less (blue) genes. Boxplots show the median and interquartile range. P-values are from t-tests. (D) Synthetic system for measuring the effect of NMD on gene expression. NMD is the ratio in mCherry expression between plasmids with and without a PTC. (E) In each genotype, we measured mCherry expression 16 times (biological replicates) for each of the four plasmids. As NMD effect is the ratio between two plasmids, for each promoter and genotype we calculated 82 ratios. Boxplots show the median and interquartile range for each set of ratios.


