
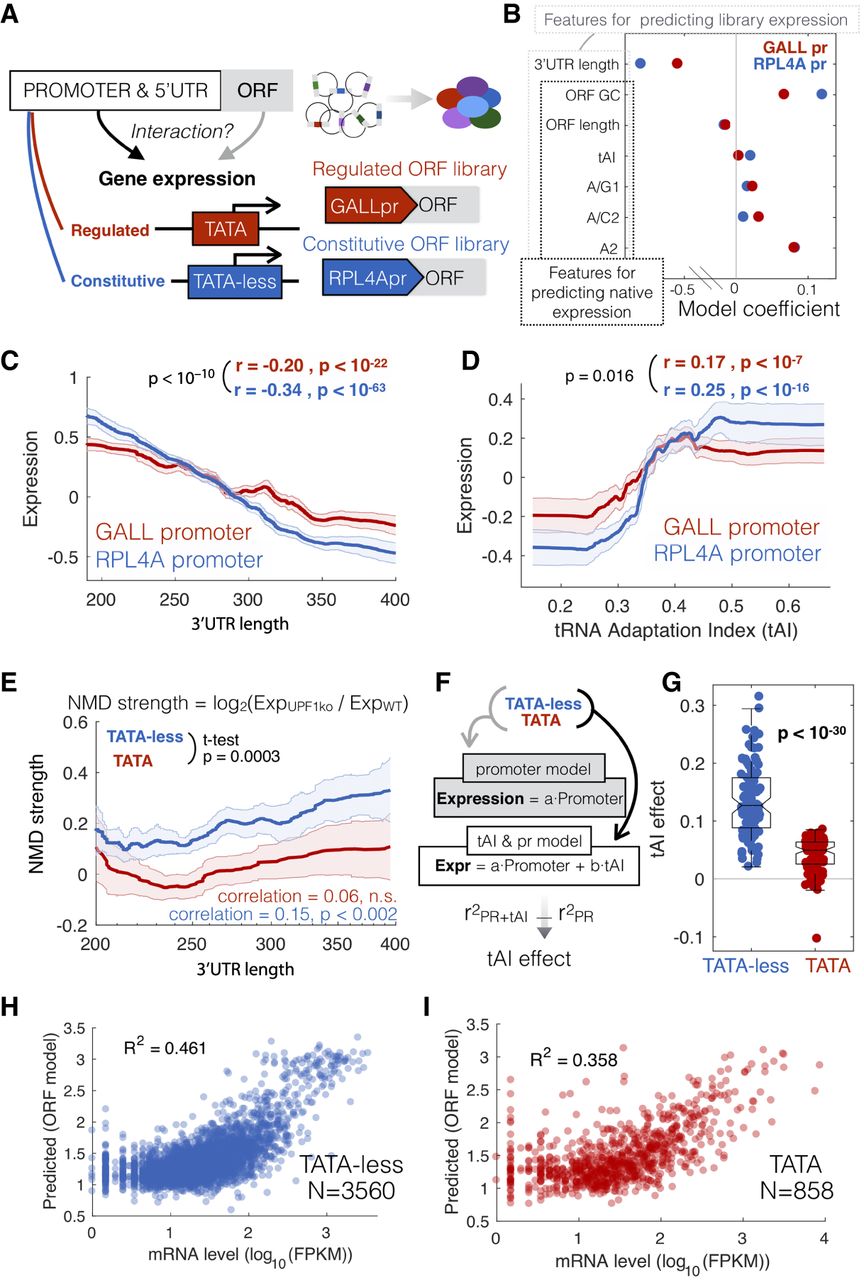
A gDNA library with different promoters identifies sequence features that interact with the promoter to determine gene expression. (A) The gDNA library was cloned under the control of either the TATA+ GALL promoter or the TATA-less ribosomal RPL4A promoter and the expression of both libraries measured in yeast growing on galactose as a carbon source. (B) Coefficients from the multiple linear model based on ORF sequence features from libraries with the two different promoters. Outlined are the features used for predicting expression in both the libraries or native genes. tAI is the tRNA adaptation index. Nucleotides followed by numbers refer to the position in a codon; e.g., A/G1 is the fraction of codons with an A or G at position 1. (C,D) Lines show the median expression for inserts binned by 3′ UTR length (C) or codon bias (D). Correlation values are for unbinned data, and the P-value is a test for a significant difference between the two correlation values using bootstrapping. (E) NMD effect, measured as the log2 ratio in mRNA (TPM) between upf1 and wild-type cells for native transcripts. Lines show the median NMD effect across transcripts binned by 3′ UTR length for TATA-containing (red) and TATA-less promoters (blue). The P-value is for a t-test for a difference in mean NMD strength for all unbinned data between TATA and TATA-less genes. (F) The makeup of two linear models, one that predicts mRNA levels from promoter-YFP data, and the other that includes codon bias (tAI) as an additional predictor. For both models, native genes are split into two classes, TATA and TATA-less, and tAI effect is the difference in R2 between the two models. (G) Difference in tAI effect for random samplings of equal numbers of genes from each class. (H,I) An ORF-encoded sequence feature model was trained to predict mRNA levels for TATA and TATA-less promoters (R2 = squared Pearson correlation coefficient).


