
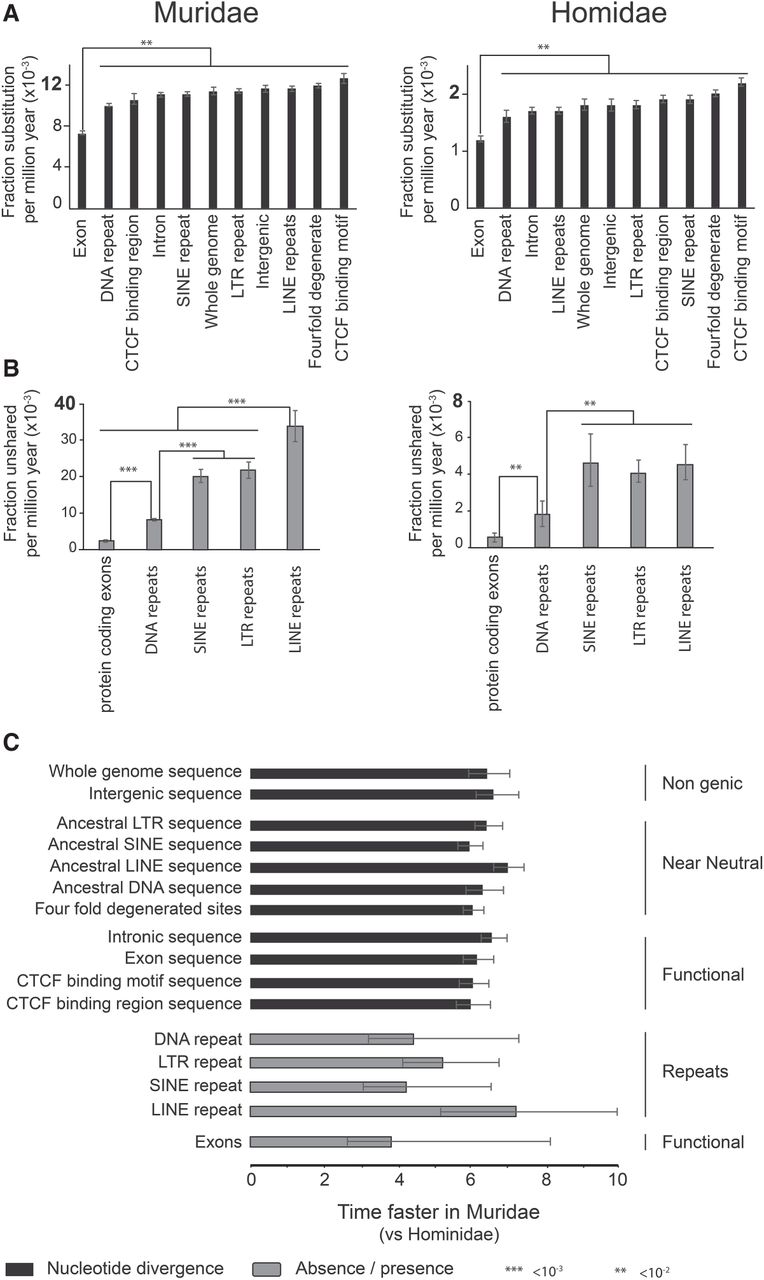
Acceleration of mutational rates in the Muridae lineage. (A) The evolutionary rate of nucleotide variation calculated for specific genomic regions. The error bar represents the standard error within the 95% confidence interval. (B) The rate of segmental turnover calculated for specific genomic regions. The error bar represents the standard error within the 95% confidence interval (Supplemental Methods SM3.2). (C) The bar chart shows the ratios of evolutionary rates between Muridae and Hominidae. Mouse versus human ratios were calculated for rates of nucleotide divergence (black bars) and the turnover rates (gray bars) for specific genomic regions (Supplemental Methods SM3.2).


