
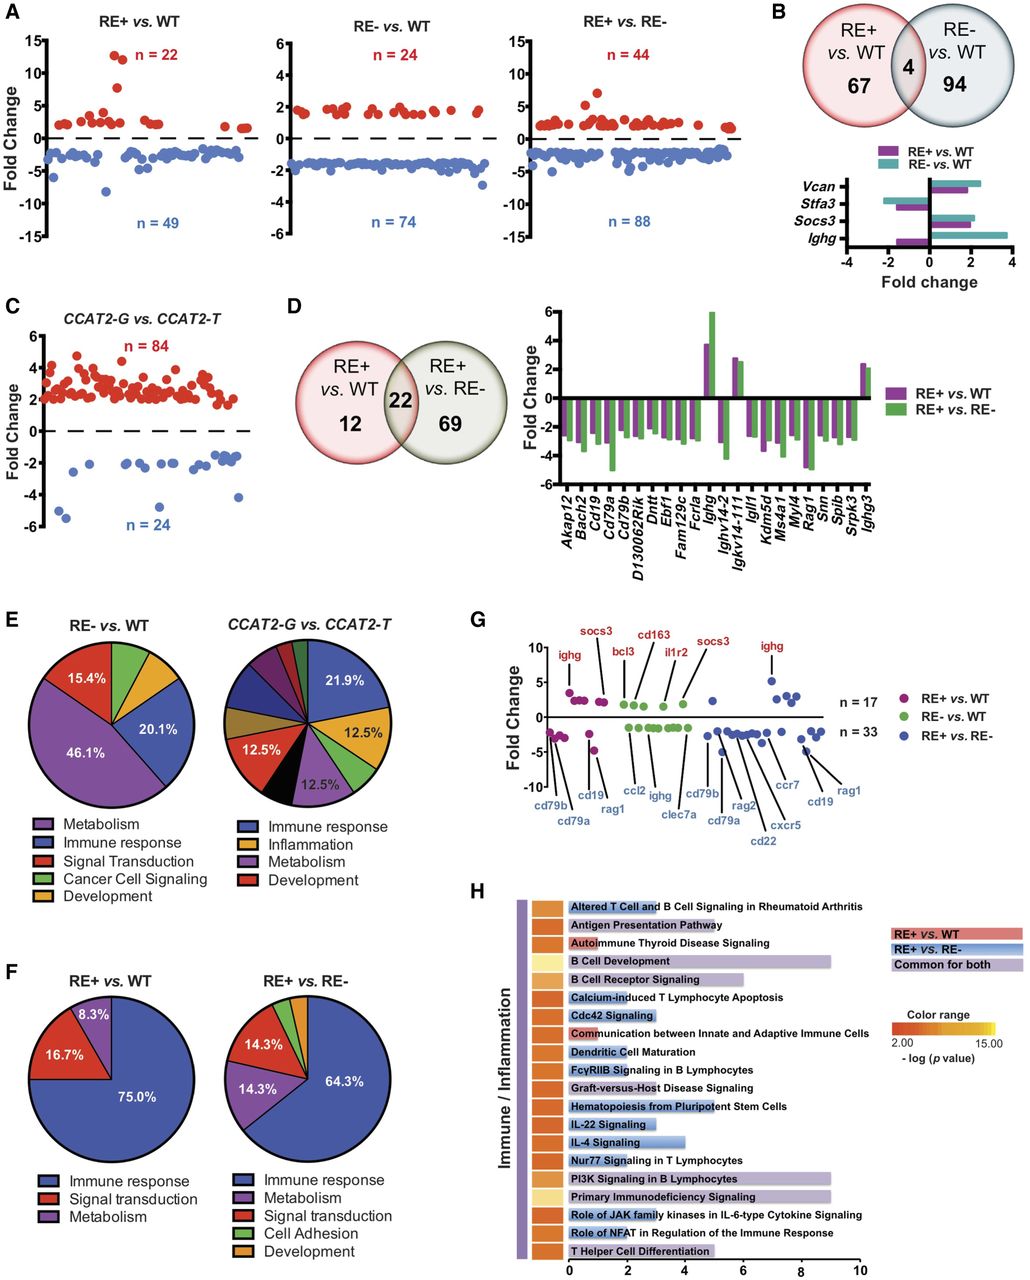
CCAT2 induces global gene expression dysregulation in vivo. (A) Scatter plots representing genes that were significantly up-regulated (in red) and down-regulated (in blue) in bone marrow cells of rs6983267-RE+ versus WT mice, rs6983267-RE− versus WT mice, and rs6983267-RE+ versus rs6983267-RE− mice (P ≤ 0.05, fold change ≥1.5). (B) Venn diagram showing genes dysregulated in rs6983267-RE+ versus WT mice and rs6983267-RE− versus WT mice. Expression level fold changes of commonly regulated genes are shown below. (C) Scatter plots representing genes that were significantly up-regulated (in red) and down-regulated (in blue) in bone marrow cells of CCAT2-G mice compared to CCAT2-T mice. (D) Venn diagram showing genes dysregulated in rs6983267-RE+ versus WT mice and rs6983267-RE+ versus rs6983267-RE− mice. Expression level fold changes of commonly regulated genes are shown to the right. (E,F) Pie diagrams depicting the top differentially regulated pathways, grouped according to their molecular function, in bone marrow cells of rs6983267-RE− (E) or rs6983267-RE+ (F) mice as described. (G) Scatter plot of significantly aberrantly regulated immune genes in the bone marrow cells of rs6983267-RE+ or rs6983267-RE− mice as described. Most important genes are listed. (H) Top canonical pathways altered in bone marrow cells of rs6983267-RE+ mice compared to WT or rs6983267-RE− mice, grouped according to their molecular function as determined by Ingenuity Pathway Analysis.


