
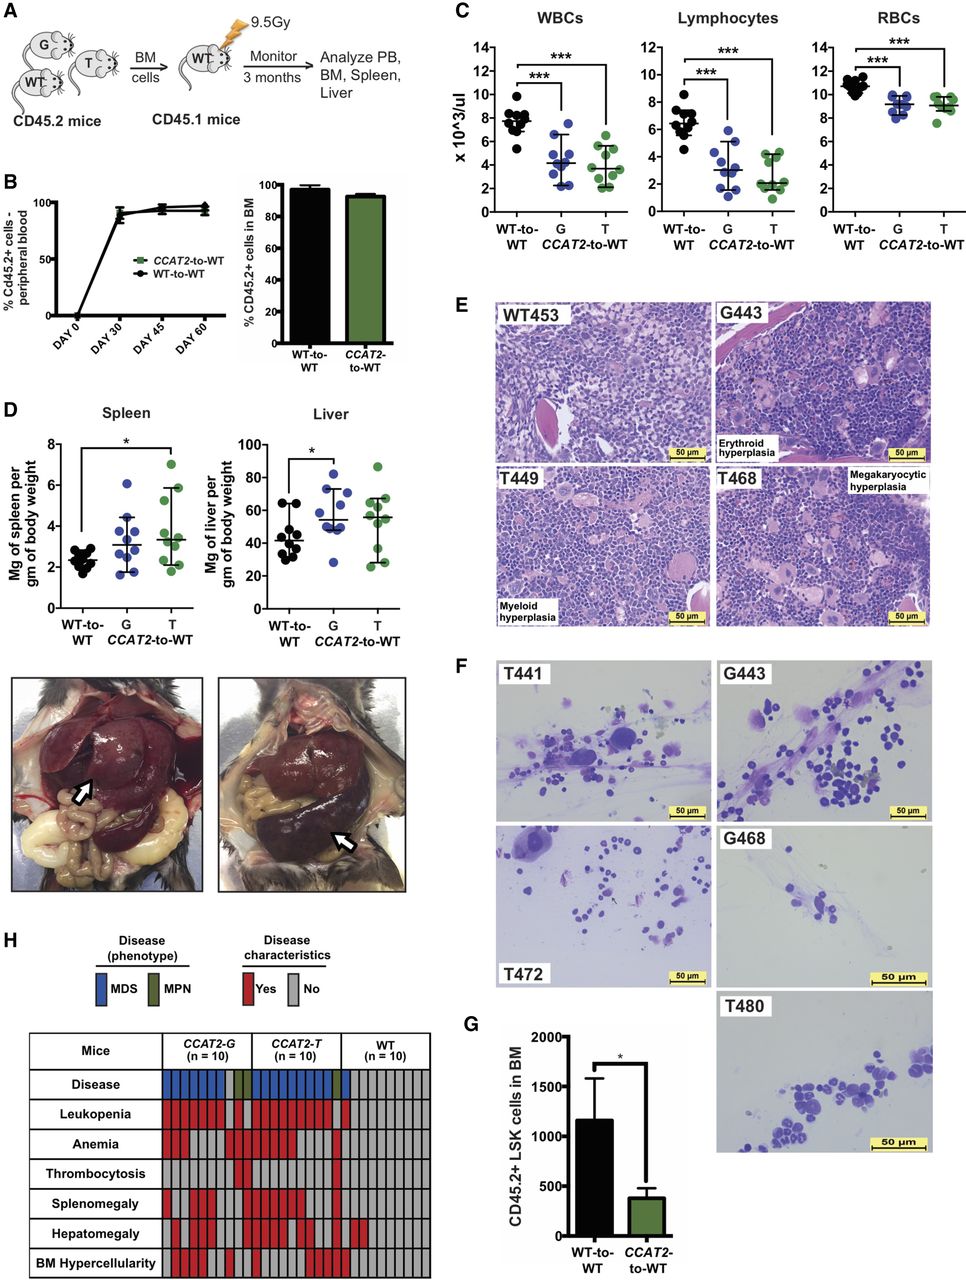
CCAT2-induced myeloid malignancies are transplantable. (A) Schematic of the transplantation experiments. (B) Flow cytometric analysis to identify proportion of CD45.2+ cells in peripheral blood and bone marrow of CCAT2-to-WT and WT-to-WT groups. (C) Peripheral blood counts (CD45.2+) of WT-to-WT and CCAT2-to-WT groups mice. Data are represented as mean values ± SEM. (D) Spleen-to-body-weight ratio (left) and liver-to-body-weight ratio (right) of WT-to-WT and CCAT2-to-WT groups (upper). Representative images of spleen and liver from CCAT2-to-WT mice are shown below. (E) Histologic sections of bone marrow (from femur) with H&E staining of WT-to-WT and CCAT2-to-WT groups; 40× magnified. (F) Representative images of Hema III-stained aberrant cells present in bone marrow smears of CCAT2-to-WT mice. (G) Flow cytometric analysis of hematopoietic stem cells in CCAT2-to-WT mice compared to WT-to-WT mice. Cells analyzed include LSK (Lin-Sca1+cKit+) cells. (H) Incidence of myelodysplastic and myeloproliferative clinicopathological characteristics in CCAT2-to-WT and WT-to-WT mice are shown. Data are represented as median values ± 95% confidence interval. (*) P < 0.05; (***) P < 0.001.


