
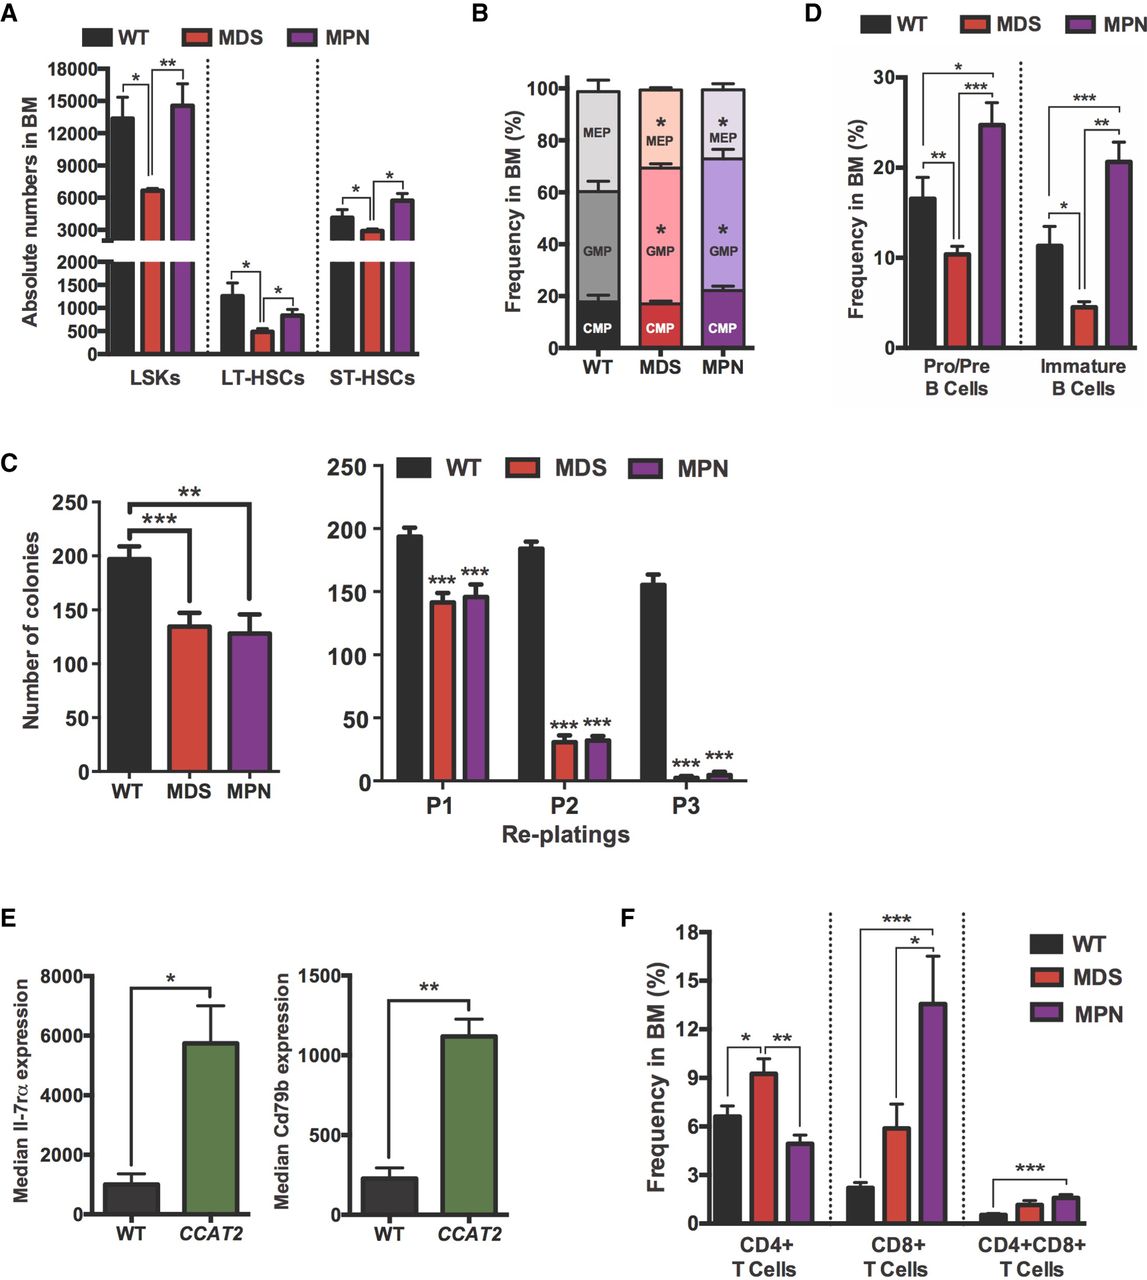
Bone marrow cells of CCAT2 mice display exhaustion of hematopoietic stem cells. (A) Flow cytometry analysis of hematopoietic stem cells in MDS- and MPN-like CCAT2 mice compared to WT mice. Cells analyzed include LSK (Lin−Sca1+cKit+) cells; long-term HSCs (LT-HSCs, defined by Lin−cKit+Sca1+CD34loCD135lo population); and short-term HSCs (ST-HSCs, defined by Lin−cKit+Sca1+CD34hiCD135lo population). (B) Flow cytometric analysis of hematopoietic progenitor cells in MDS- and MPN-like CCAT2 mice compared to WT mice. Cells analyzed include common myeloid progenitors (CMPs, Lin−cKit+Sca1−/loCD34+FcγRlo population); granulocyte–macrophage progenitors (GMPs, Lin−cKit+Sca1−CD34+FcγR+ population) and megakaryocyte–erythroid progenitors (MEPs, Lin−cKit+Sca1−CD34−FcγR− population). (C) In vitro colony formation assay (left) and in vitro serial replating analysis (right) using bone marrow cells of WT, MDS-, and MPN-like CCAT2 mice. Data are average of three independent experiments done in triplicates. (D,E) Flow cytometry analysis of B cells in different developmental phases (D) and expression of developmental markers Il-7rα and CD79b in pro–pre B cells (E) of CCAT2 mice compared to WT mice. (F) Flow cytometric analysis of T cells in different developmental phases in CCAT2-G and CCAT2-T mice compared to WT mice. Data are represented as mean values ±SEM. (*) P < 0.05; (**) P < 0.01; (***) P < 0.001.


