
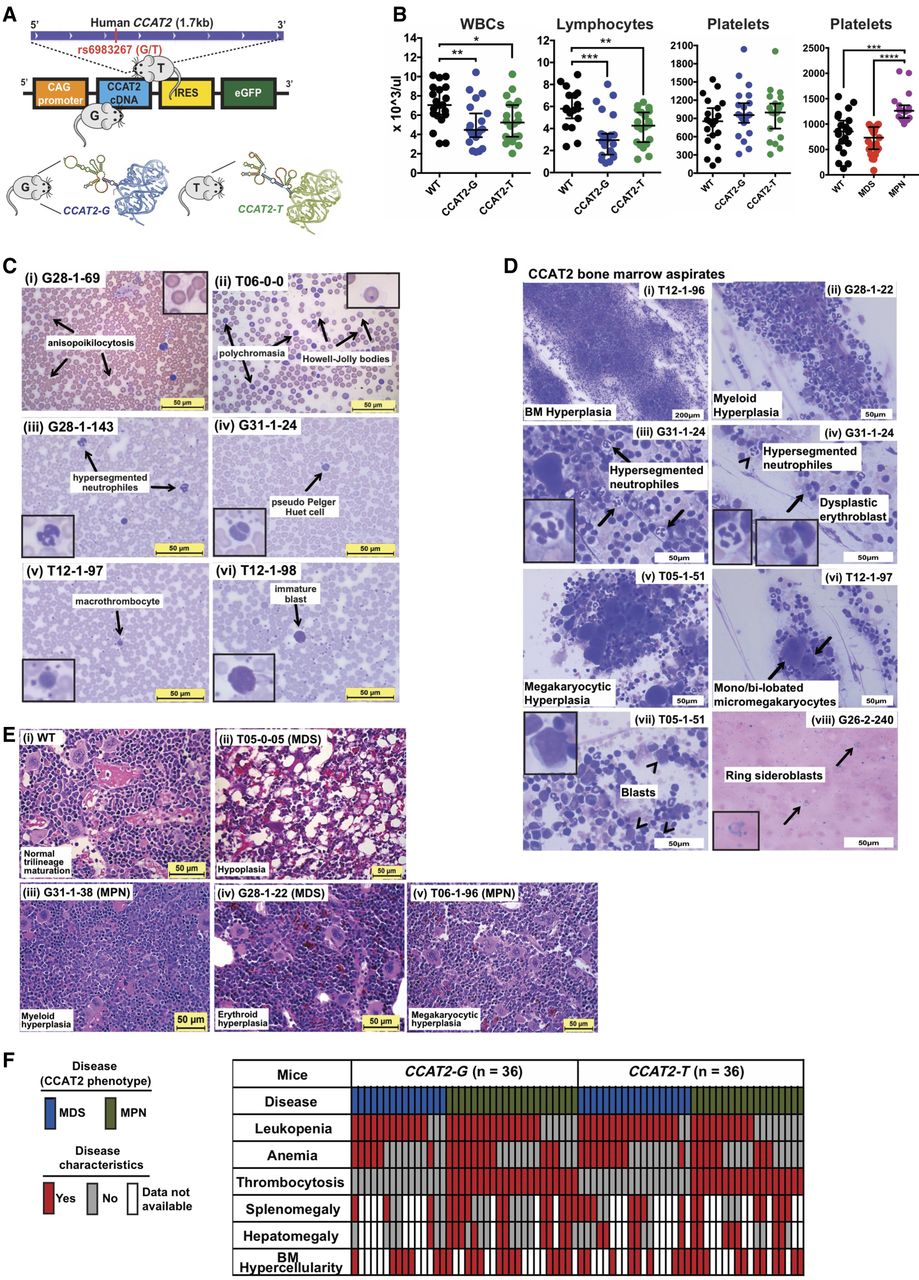
CCAT2 mice display bone marrow insufficiency with clinical features of myeloid malignancies. (A) Schematic of CCAT2-plasmid cassette inserted into the mouse genome using pronuclear injection. A cartoon depicting the allele-specific secondary structure of 1.7-kb CCAT2 transcripts, which differ mostly at the ∼500 bp region surrounding the rs6983267(G/T) SNP, is shown at the bottom of panel A. (B) Peripheral blood counts of WT, CCAT2-G, and CCAT2-T mice. (C) Representative images of aberrant circulating peripheral blood cells in CCAT2-G and CCAT2-T mice. Arrows indicate the aberrations described. Images in the inset are 40× magnified aberrant cells. (D) Representative images of Hema III-stained aberrant cells present in bone marrow smears of CCAT2-G and CCAT2-T mice. Arrows and arrowheads indicate the aberrations described. Images in the inset are 40× magnified aberrant cells. (E) Histologic sections of bone marrow (from femur) with H&E staining; 40× magnified. Normal bone marrow from WT mice (i) in comparison with myeloid hyperplasic (ii), erythroid hyperplasic (iii), and megakaryocytic hyperplasic (iv) bone marrow from CCAT2-G and CCAT2-T mice. (F) The incidence of myelodysplastic and myeloproliferative clinicopathological characteristics in CCAT2-G and CCAT2-T mice are shown. Data are represented as median values ±95% confidence interval. (*) P < 0.05; (**) P < 0.01; (***) P < 0.001; (****) P < 0.0001.


