
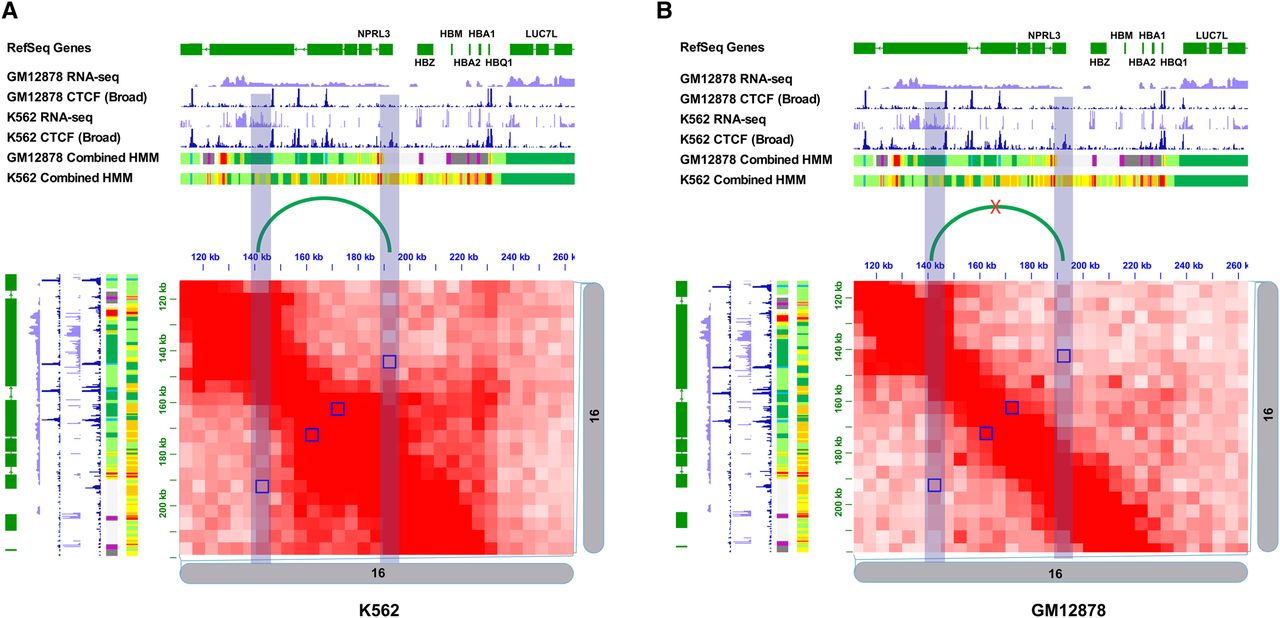
Figure 6.
DCIs in the alpha-globin region as detected by FIND between K562 and GM12878 cells. (A) Hi-C contact map of the K562 at the alpha-globin locus. Differential interactions (Q-value <1 × 10⁻⁴) are shown in blue squares; the CTCF signal change region is highlighted by the blue bars. (B) The corresponding region shown in the GM12878 with the same regions highlighted.


