
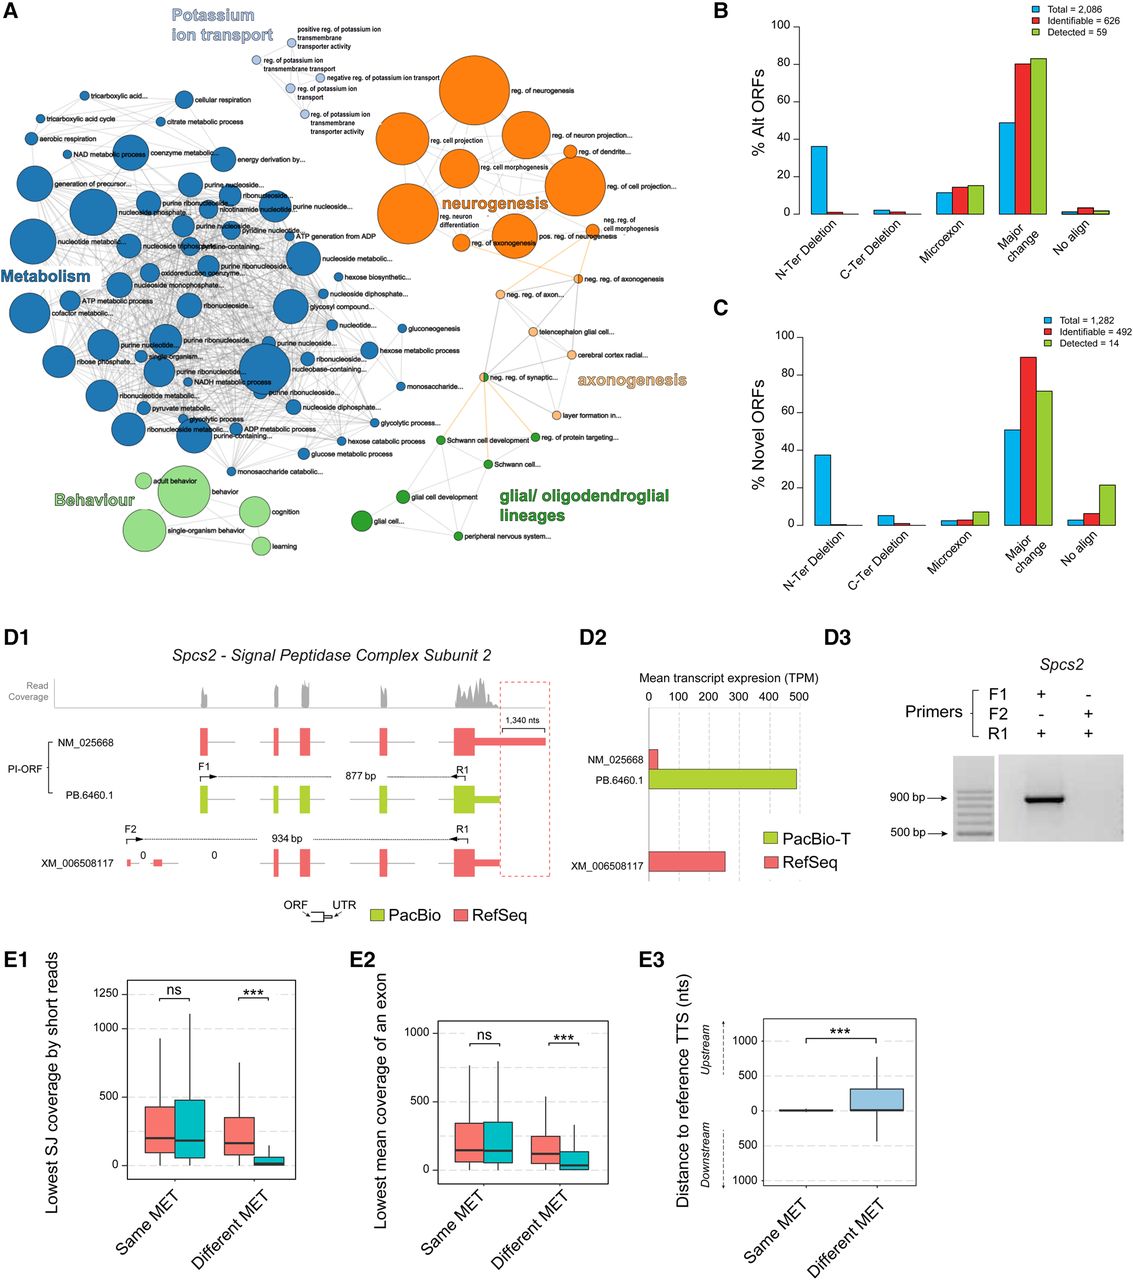
Functional diversity associated with genes with novel transcripts, variability of 3′ UTR in PI-ORFs transcripts, and comparative analysis of protein differences between PI and non-PI-ORFs. (A) Gene Ontology enrichment analysis for genes expressing novel transcripts. Analysis of the type of protein changes introduced by (B) Alternative ORFs and (C) Novel ORFs with respect to the PI-ORF of the gene. Blue: ORFs computationally predicted in the curated transcriptome; red: ORFs predicted to be identifiable by unique peptides; green: ORFs detected in proteomics databases with at least two peptide spectrum matches (PSMs). (D) Example of 3′ UTR variability in a PI-ORF that leads to a quantification error. (D1) Transcripts associated with the Spcs2 gene according to PacBio sequencing (green) and by RSEM quantification using RefSeq (red). The profile of mapping short reads at the Spcs2 locus is shown in gray. The positions of transcript-specific primers are indicated by arrows, and differences at the transcription termination sites are highlighted by a red dashed box; 0 indicates splice junctions lacking any short-read support. (D2) Short-reads-based average transcript expression levels of Spcs2 transcripts using either RefSeq or PacBio-T references. (D3) Validation of Spcs2 transcript expression by RT-PCR: PB.6460.1/ NM_025668 but not XM_006508117 was amplified. (E) Analysis of the most expressed transcript (MET) in genes with MET differences between PacBio-T and RefSeq quantifications. Kruskal-Wallis Test, (K-W), (***) P < 0.001, (ns) not significant. (E1) Lowest SJ coverage by short reads in METs. (E2) Lowest mean exon coverage by short reads in METs. (E3) Distance between the TTS of the METs and their FSM references. Same MET means both PacBio-T and RefSeq select the same MET; Different MET means RefSeq selects a MET that is not manually curated and PacBio-T selects a MET that is manually curated.


