
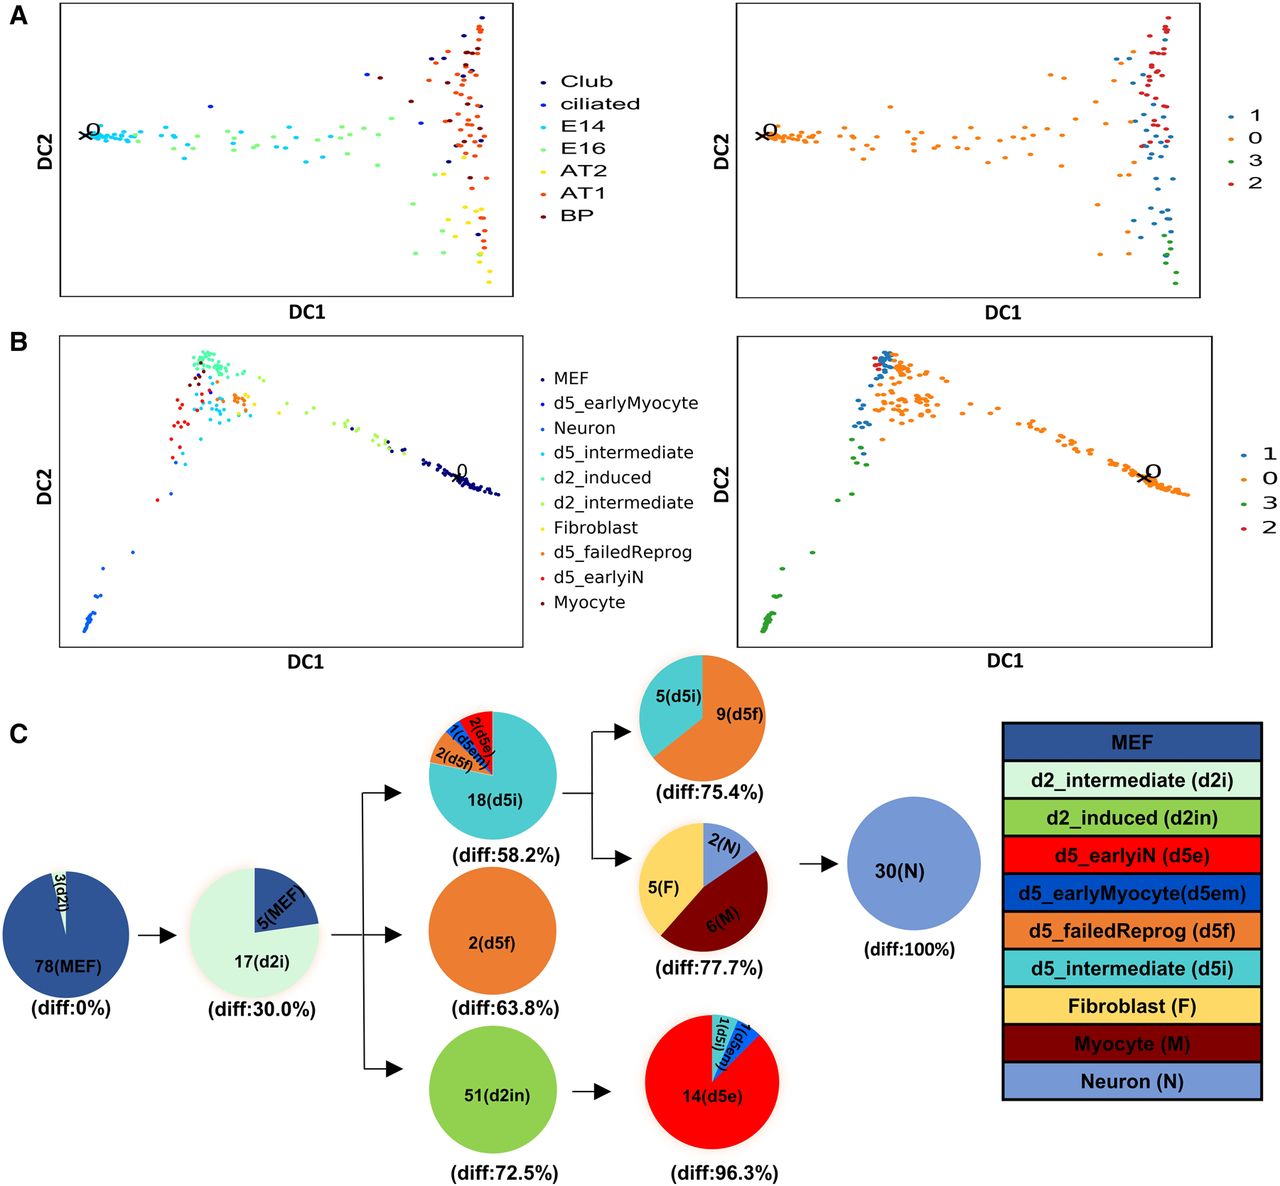
Performance comparison with diffusion pseudotime (DPT). (A) DPT analysis of the Treutlein et al. (2014) mouse lung single-cell data (the data used in Fig. 2). (Left) Cells colored by their type as determined by Treutlein et al. (2014). (Right) Cell assignment by DPT using default parameters. While DPT finds some structure in the data, it is unable to separate the AT1 and Club cells and does not show any major branching prior to E18.5. (B) DPT analysis of mouse embryonic fibroblasts (MEFs) reprogramming data (Treutlein et al. 2016) setting 2. While the DPT model finds a branch leading from the MEF cells to the neurons, it does not order correctly the intermediate day 2 and day 5 cells (note that day 5 cells are mostly on the other branch and only day 2 cells are close to neurons). (C) In contrast, a model based on our method for the same data correctly places most day 2 cells in the second level with day 5 cells closer to the neurons. See also text for discussion.


